
Donchian channels were developed by legendary futures trader Richard Donchian in the 1960s and have stood the test of time as a powerful volatility indicator that many trend-following traders still use to this day.
Let’s examine how you can use Donchian channels to enhance breakout trading and boost your profits.
Trading with up to 90% profit
What are Donchian channels?
Donchian channels look very similar to Bollinger Bands or Keltner channels and are represented by three lines: an upper bound, moving average, and lower bound. Unlike Bollinger Bands, which uses standard deviations to define dynamic support and resistance levels, Donchian channels use the high and low over a given period, usually 20, and these highs and lows are plotted around price.
Effective strategies in your mailbox
Subscribe and discover a fund of trading knowledge
Great! Please check your email
We’ve sent you an email to confirm your subscription
Something went wrong
Try reloading the page. If that doesn’t help, please try again later
How do Donchian channels work?
Donchian channels are one of the most basic but effective indicators you can add to your chart.
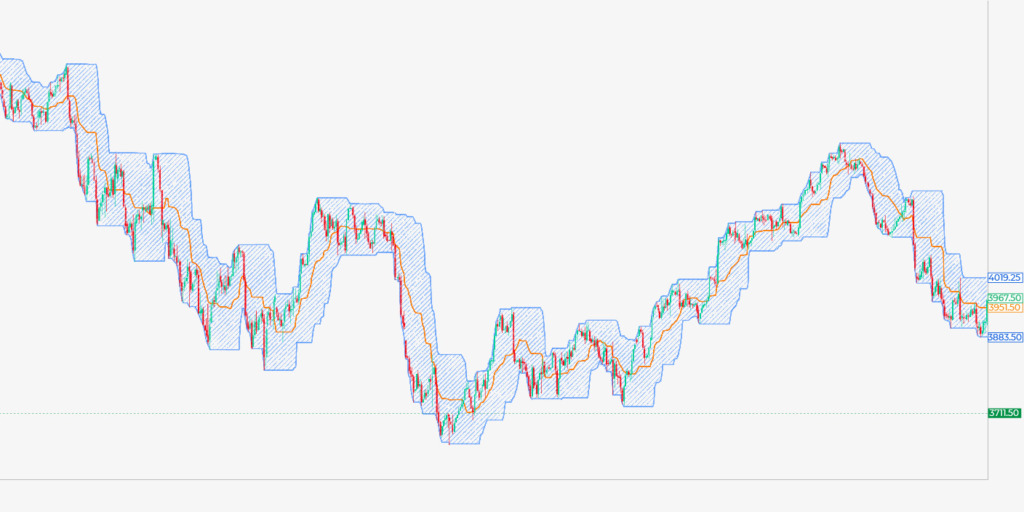
Donchian channels are primarily a measure of volatility. When volatility is high, the bands will widen (or become taller, however you look at it). When volatility is low, you’ll see the bands narrow significantly, especially during consolidation phases.
When price is hugging the upper band tightly and consistently making new highs while the lower bound flattens, it can be assumed that bullish momentum is present. Meanwhile, the opposite is also true: bearish momentum will look like a lower bound continually moving lower while the upper band stays flat.
How do you calculate Donchian channels?

The calculation is straightforward:
Start from $10, earn to $1000
- Upper bound: the highest point over the past N periods
- Lower bound: the lowest point over the past N periods
- Moving average: (Upper bound price + lower bound price)/2
N can be whatever number you like.
How to start trading with $200 and minimum risk
Don’t let a small budget deter you from trading! Learn how to start trading with $100 or $200 and make the most out of this money!
Read more

How do you use Donchian channels?
Typically, Donchian channels are used over 20 periods, i.e., the last 20 candles. However, you can use whatever period you prefer. Like moving averages, 50 or 200-period channels will provide fewer signals but will likely better show you the long-term trend and reduce the number of false signals.
You can think of it like this: when trends are strong, like in the example above, they will put in highs or lows greater than the last 20 periods. As price moves to its lowest point in the previous 20 periods, the lower bound will continuously move down, indicating that there’s a strong bearish trend and vice versa.
Effectively trading breakouts with Donchian channels
Because of the power of Donchian channels to indicate trends, we can use them for trading breakouts. Combining Donchian channels with a momentum oscillator, like RSI or MACD, is also useful for detecting false breakouts.
Of course, it goes without saying you can’t just use Donchian channels to trade. Like all indicators, they complement your price action analysis and should be used to spot opportunities that conform to your overall bias.
For example, you shouldn’t use Donchian channels to determine a bearish trend. Instead, you should identify a potential bearish trend with your own eyes, then use a Donchian channel as confirmation.
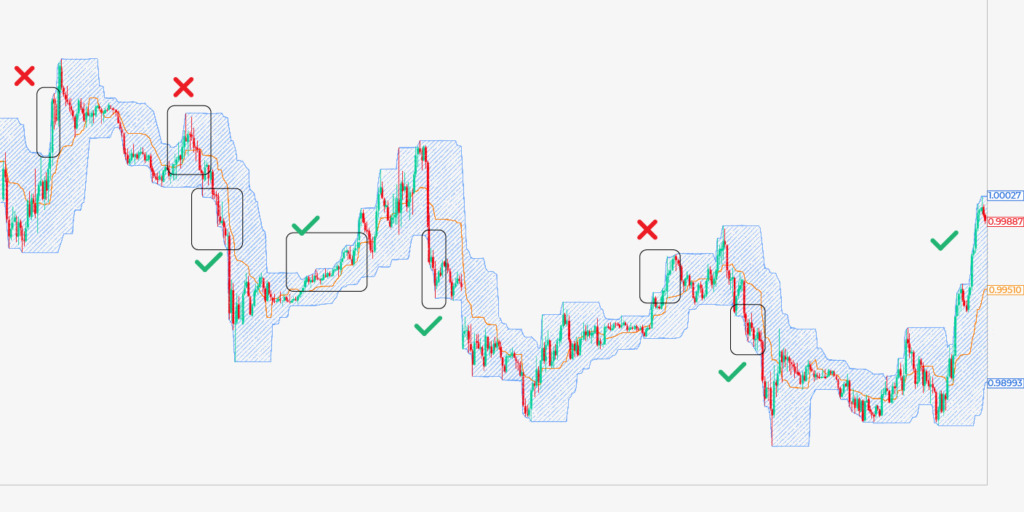
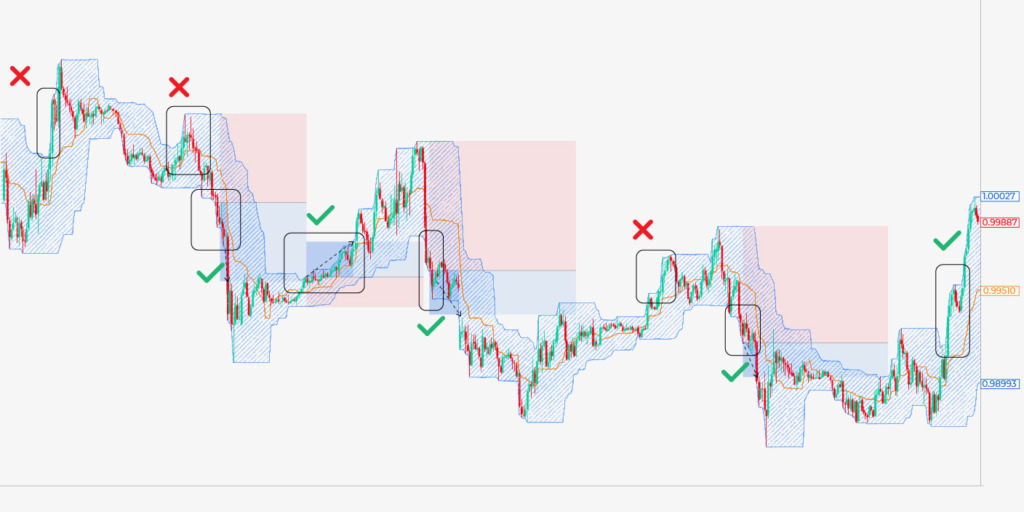
Can you spot what ties each entry above together? First, you’ll notice that the upper or lower bound is quickly ascending/descending. Secondly, these areas had three consecutive touches to the bound, indicating that price was continually making new highs/lows.
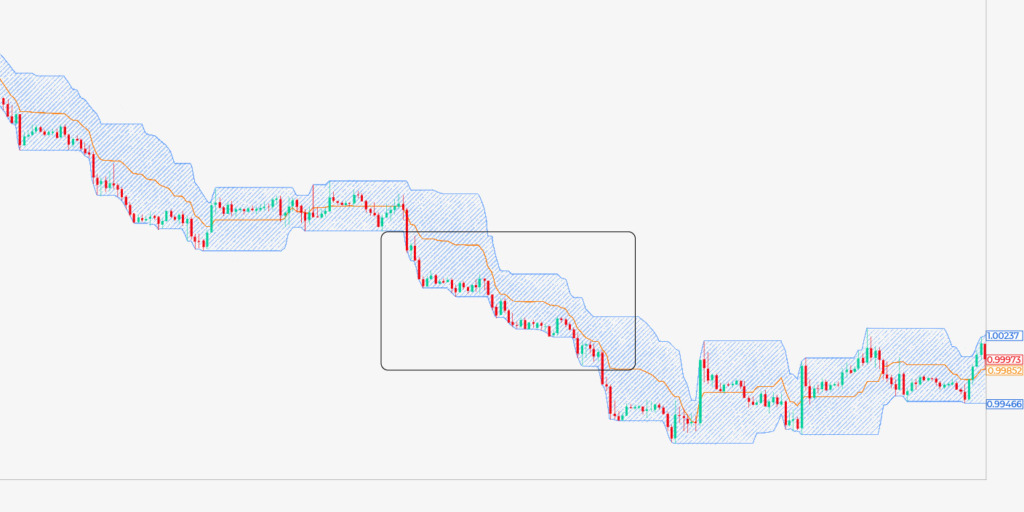
Why is this an effective strategy? Well, look at the bounds that stair steps up, like the price action in the middle. There is a bullish trend, but the stair stepping doesn’t indicate the bullish momentum we’d want to enter from.

Instead, you want the action prior (denoted by the tick) as a) it offers better profit potential and b) it shows that the market is in general agreement that price is bullish. The choppy back and forth indicates some disagreement over whether price is bullish or bearish.
You’ll see many trading gurus talk about using the opposing bound as a trailing stop. This is counterintuitive.
Firstly, notice how wide your stop needs to be initially. If you’re sizing your positions by the distance of your stop loss and percentage risk (which you should be), then your positions will be very small with this risk management strategy.
Secondly, notice how much profit you give back to the market with this approach. Every time, price retraces at least half of its move to touch the opposing bound, giving you dire risk:reward; above, the best R:R found is 1.13, even with a strategy that led to some reasonably early entries.
Instead, your approach can be much simpler. Think about a bull trend: it’s denoted by consecutive higher highs and higher lows, right? So why not use these structural points as your stop loss?
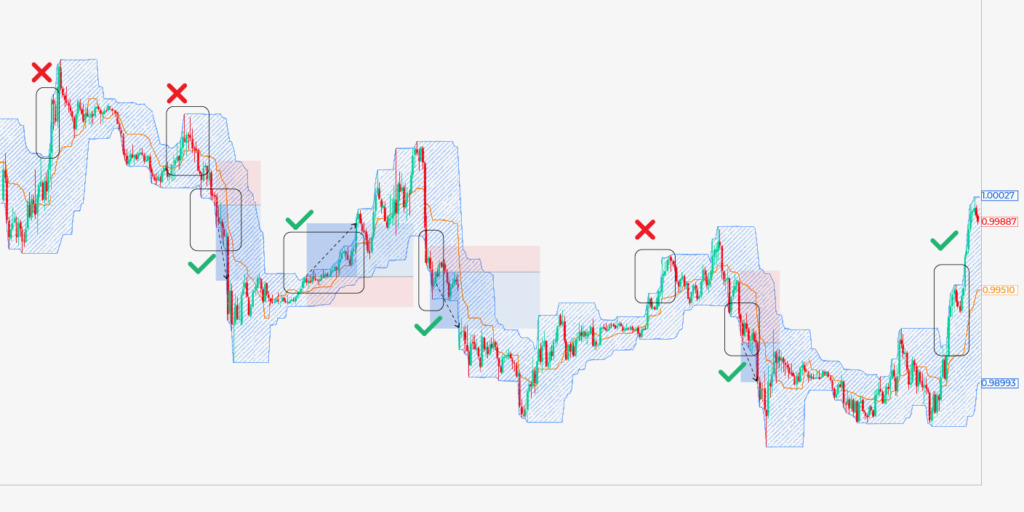
Now, you can see we have appropriately defined entries with clear criteria of where our stop loss should go. Just use the swing highs and lows as your stop. You’ll notice that after getting stopped out, the trend tends to reverse in the opposite direction before touching the opposite bound.
It’s also prudent to take partial profits at previous lows or highs, as these are likely areas of support or resistance. By doing this, you can make slightly more profit than purely using stop losses like above.
Earn profit in 1 minute
+10 <span>Like</span>