Trading in the stock market can be challenging, especially for beginners. However, understanding various indicators and their implications is crucial for successful trading. One such indicator is the fractal indicator, which helps identify trends and determine optimal trade positions.
In this article, we will explain what the fractal indicator is, how it functions, and its practical applications in trading.
Start from $10, earn to $1000
What is the fractal indicator?
The fractal indicator is a tool used in technical analysis to predict market movements by analyzing fractals. Fractals are patterns that repeat on different time scales. In finance, these patterns appear at different price points.
A fractal consists of five or more bars. The highest and lowest points are found in the middle bar, while the other bars have lower or higher highs and lows. The fractal is complete when the price forms a new high or low two bars to the right of the pattern.
The fractal indicator suggests that asset price fluctuations are not entirely random. By observing price action patterns, you can identify prevailing market trends.
Effective strategies in your mailbox
Subscribe and discover a fund of trading knowledge
Great! Please check your email
We’ve sent you an email to confirm your subscription
Something went wrong
Try reloading the page. If that doesn’t help, please try again later
How does the fractal indicator work?
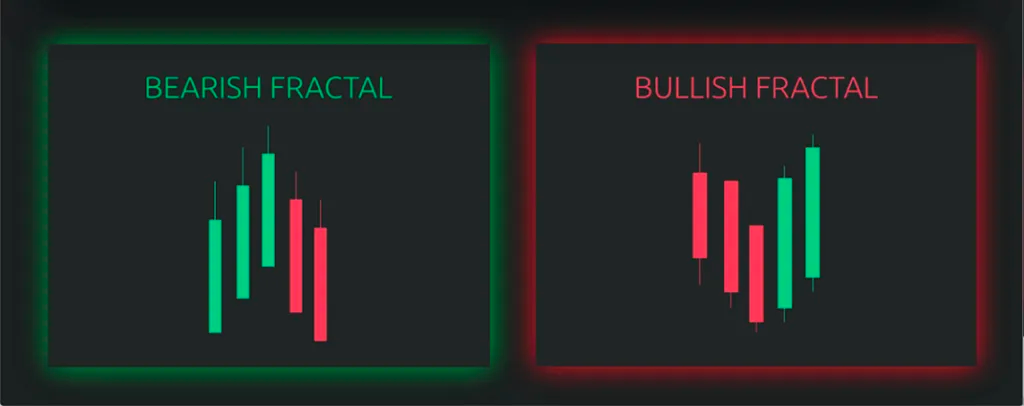
The fractal indicator identifies price action patterns that indicate a trend. A bullish fractal occurs when the price forms a pattern of two or more bars, with the highest high in the middle bar. Conversely, a bearish fractal occurs when the price forms a pattern with the lowest low in the middle bar.
A bullish fractal suggests that the price trend may continue upward.
On the other hand, bearish fractal forms suggest further market declines are possible — a short position entry signal for traders.
The fractal indicator can be used in conjunction with other technical analysis tools, such as moving averages or support and resistance levels, to confirm predicted trends and determine trade entry points.
How to use the fractal indicator in your trading strategy?
Now that we understand how the fractal indicator works, let’s discuss how you can incorporate it into your trading approach. Follow these steps:
- Identify the trend: Before using the fractal indicator effectively, establish the market trend using tools like moving averages and support and resistance levels.
- Apply the fractal indicator: Once the trend is identified, apply the fractal indicator to the chart. Most trading systems have access to this indicator, which can be used on any time period.
- Identify the fractals: Look for fractals on the chart. A bullish fractal suggests an upward price trend, while a bearish fractal indicates potential price falls.
- Confirm the trend: Use the fractal indicator in conjunction with other technical analysis tools to validate the emerging trend. For example, use a moving average to support a bullish trend indicated by the fractal indicator.
- Enter a trade: If you spot a fractal signal and confirm it with additional indicators, enter a trade in the direction of the expected reversal.
Note! Many traders combine the Bill Williams indicator with other indicators like Alligator.
How to start trading with $200 and minimum risk
Don’t let a small budget deter you from trading! Learn how to start trading with $100 or $200 and make the most out of this money!
Read more

Identifying trend reversals with fractals
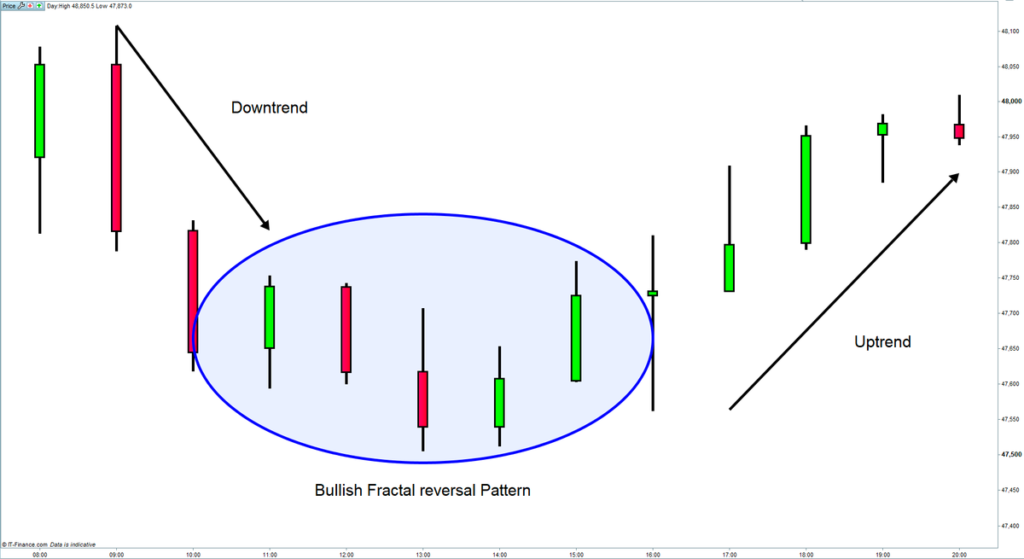
A common application of the fractal indicator is identifying trend reversals. Fractals can signal the possibility of a trend reversal as an uptrend or downtrend loses momentum.
Earn profit in 1 minute
Here’s how to utilize fractals for this purpose:
- In a series of five bars, the middle bar should have the highest high (in an uptrend) or the lowest low (in a downtrend).
- Once you locate a fractal, anticipate a breakout in the opposite direction. If you identify a bearish fractal (five bars with the lowest low in the middle), watch for the price to break above the high of the middle bar to confirm a trend reversal.
- After the breakout is confirmed, enter a trade in the direction of the new trend.
Remember to verify any trend reversal with additional technical indicators or research, as fractals can sometimes produce false signals.
Combining fractals with other technical indicators
Fractals can provide more insights when combined with other technical indicators.
For example, many traders use fractals alongside moving averages and trend lines to confirm trend reversals. Others combine fractals with oscillators like the Relative Strength Index (RSI) or the Moving Average Convergence Divergence (MACD) to identify trade entry points.
Find the optimal set of technical indicators for your trading style through trial and error.
The bottom line
The fractal indicator is a versatile tool that can be incorporated into various trading methods. Fractals can help you identify key levels, validate trend reversals, and make informed trading decisions.
Remember that fractals, like any other technical indicator, work best when combined with additional analysis and risk management strategies. Successfully integrating fractals into your trading strategy requires experience and practice.
Trading with up to 90% profit
<span>Like</span>