
Oscillators are one of the types of indicators traders can use to identify trends, buy and sell signals, and changes in market sentiments. There are many oscillators, and the most popular ones are the relative strength index (RSI), the stochastic oscillator, the MACD indicator, and the awesome oscillator. Although they have their unique features and are calculated differently, there are common rules you can apply to make the most of them. There is no best oscillator indicator. Below you will find six best practices that will allow you to tailor indicators to your trading strategy.
Start from $10, earn to $1000
What is an oscillator in trading?
Did you know that an oscillator itself is a mechanical or electronic device?
In technical analysis, indicators are called oscillators because they have the same concept–they include oscillation principles. Oscillation is a periodic movement between two things based on changes in energy. In technical analysis, oscillators move between two bands, usually 0 and 100, based on changes in a price.
Each oscillator has its own form. For instance, the RSI consists of one line, the stochastic includes two lines, and the MACD indicator is formed by two lines and a histogram. The primary signal of oscillators is overbought and oversold market conditions. However, they can also be used to identify buy and sell signals and confirm long- and short-term price reversals.
Effective strategies in your mailbox
Subscribe and discover a fund of trading knowledge
Great! Please check your email
We’ve sent you an email to confirm your subscription
Something went wrong
Try reloading the page. If that doesn’t help, please try again later
Practice #1: Overbought and oversold conditions

Traders mostly use oscillators to find overbought and oversold conditions. This allows them to determine future rises and falls in the price. When the asset is oversold, its price is below the fair value and is expected to rise soon. When the asset is overbought, its price is above the fair value and is expected to fall soon.
Overbought and oversold zones depend on the oscillator. For example, the market is considered oversold when the relative strength index moves below 30, when the stochastic falls below 20, or when the MACD histogram sets new lows.
When identifying overbought and oversold conditions, traders should remember that a move of the oscillator in either zone doesn’t identify the exact time the price will turn around. Sometimes, it takes weeks for the market to change its direction. Additionally, overbought and oversold conditions don’t necessarily mean a trend reversal–it can be just a short-term correction.
However, it doesn’t mean the overbought/oversold signal is useless. Traders base their strategies on it but use other tools to confirm it.
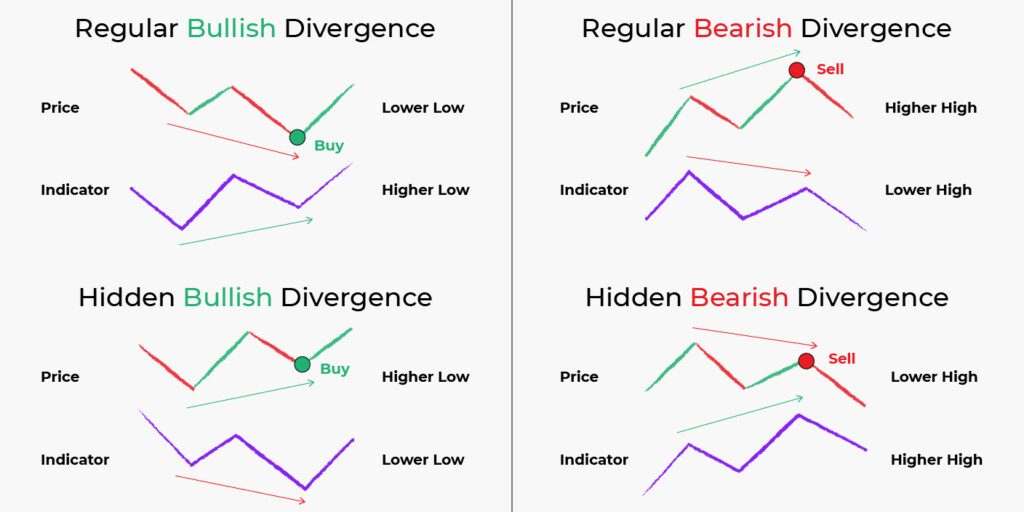
Practice #2: Learn divergence signals
Divergence is one of the simplest and most accurate signals traders use when trading with oscillators. The idea is that oscillators follow the price moves, so they fall when the price declines and rise when the price increases. However, sometimes an oscillator and a price move in different directions. This happens because either buyers or sellers lose their strength; this is not visible on the price chart but is already taken into account in an oscillator. The common rules are reflected below, where regular divergence is considered more reliable than hidden.
Cryptocurrencies: what to expect in 2023
2023 is expected to be the year of recovery for the crypto market. Read on to see what to expect in 2023 for cryptocurrencies.
Read more

Practice #3: Look for crosses
A cross is an important signal that can identify buying and selling opportunities. There can be different approaches. For instance, if the oscillator includes lines with different periods, a break of a faster one above the slower one is considered a buy signal. In contrast, a break of a faster one below the slower one is usually a sell signal. There can be lines with the same period. For instance, in the RSI indicator with the simple moving average, the RSI line is considered fast and the SMA line is slow.
Earn profit in 1 minute
Also, traders look at a cross of a certain level. For example, if the MACD histogram breaks above 0, it’s a buy signal; when it breaks below 0, it’s a sell signal.
Practice #4: Use standard settings
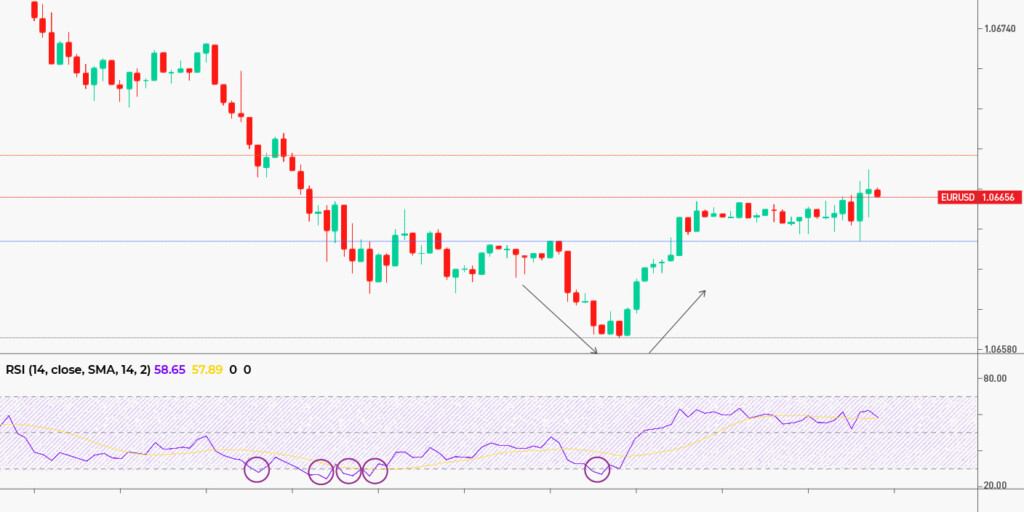
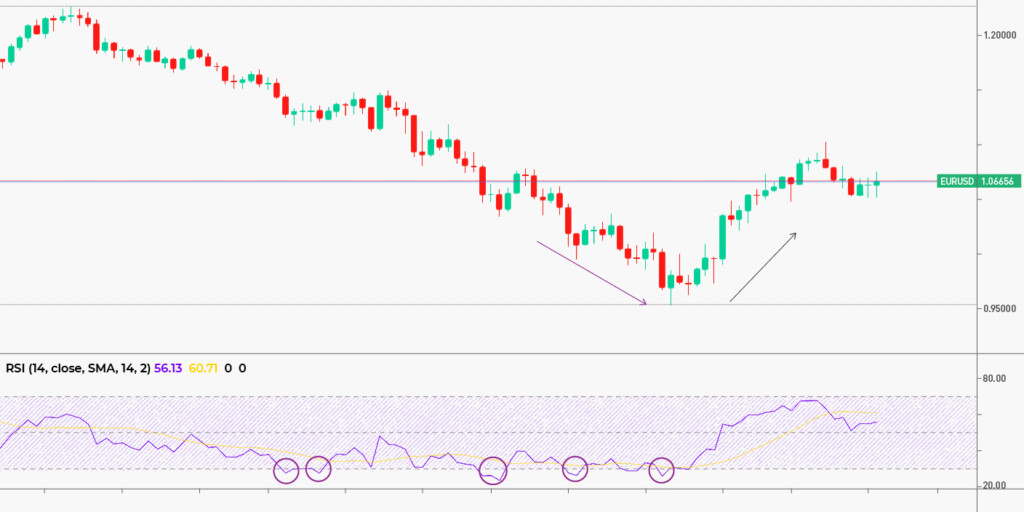
Although oscillator parameters are customized, one of the benefits of oscillators is that they work well in different timeframes and for different assets with their standard settings. You can change them if you find out your strategy works better with other parameters, but if you are a newbie trader, you can keep those set automatically on the trading platform you use. Usually, traders change indicator settings to increase the number and correctness of signals. However, if you compare the 1-minute and weekly charts of the EUR/USD pair, you will notice that the number of oversold signals the RSI indicator provided and their reliability are almost equal.
Practice #5: Look for other signals
Overbought/oversold conditions, divergences, and crosses are standard signals traders look for when applying oscillators on the price chart. However, that’s not all. Many traders don’t know about other alerts they can receive from oscillators because, usually, they are discovered not by developers of oscillators but by other analysts. You can look for additional signals online or develop your own. However, you must recheck the signal reliability on a demo account or historical data in both cases. Choose different timeframes and consider assets with different levels of volatility to avoid mistakes in live trading.
Practice #6: Know how to confirm signals
You should remember that oscillators can provide incorrect signals. Therefore, it’s risky to use them alone. Traders confirm their signals by either combining two oscillators or using other technical analysis tools, including volatility and trend indicators or support and resistance levels.
Final thoughts
Oscillator trading is one of the easiest and most reliable ways to forecast a price direction. Although oscillators can fail and each signal must be confirmed, these pitfalls relate to all technical analysis tools traders implement. If you learn the above-mentioned tips, you will be able to use any oscillator without spending hours learning its rules.
Sources:
Oscillator, Investopedia
An Introduction to Oscillators, Investopedia
How to Use Oscillators to Warn You of the End of a Trend, babypips.com
Trading with up to 90% profit
+2 <span>Like</span>