
The market before the financial crisis of 2008 was surprisingly good for many consumer sectors. Sales of clothing improved 19%, toys and electronic goods each went up 30%, sports goods gained 50% — all in a flat market. This proves that even flat markets can offer lucrative opportunities if you know what to focus on.
In this short article, you’ll see the main difference between directional movement and passive oscillation and how they form in the market.
Trading with up to 90% profit

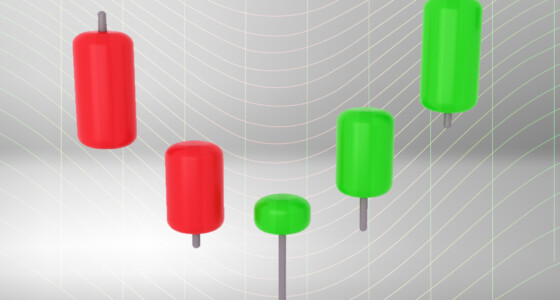
How the market creates an uptrend
For an average trader, an asset is worth buying if it’s undervalued and seems profitable. Some are looking for the next Apple or Microsoft, which will increase capitalization and share prices over time. And if they buy these shares low, they can sell them high later.
So, market participants start buying, shifting the balance of supply and demand, and the stock starts going up. Some traders may not even know why they’re buying; they just follow the crowd. The crowd just needs the confidence that the trading price and value are not equal — the conclusion may come from the news, experts, or their own analysis.
Effective strategies in your mailbox
Subscribe and discover a fund of trading knowledge
Great! Please check your email
We’ve sent you an email to confirm your subscription
Something went wrong
Try reloading the page. If that doesn’t help, please try again later
Conditions for a flat market

However, after the initial euphoria, traders and investors may start losing their confidence. They may realize that company’s fundamentals are not that great, or the current increased value is not justified. When some buyers are no longer willing to pay sellers more, the uptrend slowly starts to die down. It makes the price move in a narrow channel, which some consider the basic state of the market — flat.
Trader’s level test
Answer 7 short questions and define your level as a trader. Take the test now to evaluate your real knowledge!
Start test

How the market creates a downtrend

The balance between buyers and sellers doesn’t last forever. Eventually, the asset becomes overvalued or undervalued (i.e., starts trading higher or lower than its intrinsic value). It depends on which group becomes more powerful: buyers or sellers.
Interestingly, a downward can occur in any time frame and under any trading volume conditions. Normally, the drop in average trading volume coincides with downtrends because investors are less interested in a declining stock. However, a falling price can be coupled with higher volume during high-profile negative news for the company.
So, don’t look at the volume — look at closing prices. If an uptrend starts setting lower and lower highs, it can be a sign of a forming downtrend. Wait for a confirmation from an indicator and act.
Takeaway
If you’re a private investor, you must adapt to different market conditions. Of course, you could become a market maker if you have a spare capital of millions of dollars and the required certificates. But the more accessible solution is to learn how to behave in uptrends, downtrends, and flat markets. Use this knowledge in technical analysis, forecasting, and when opening new positions.
Start from $10, earn to $1000
<span>Like</span>