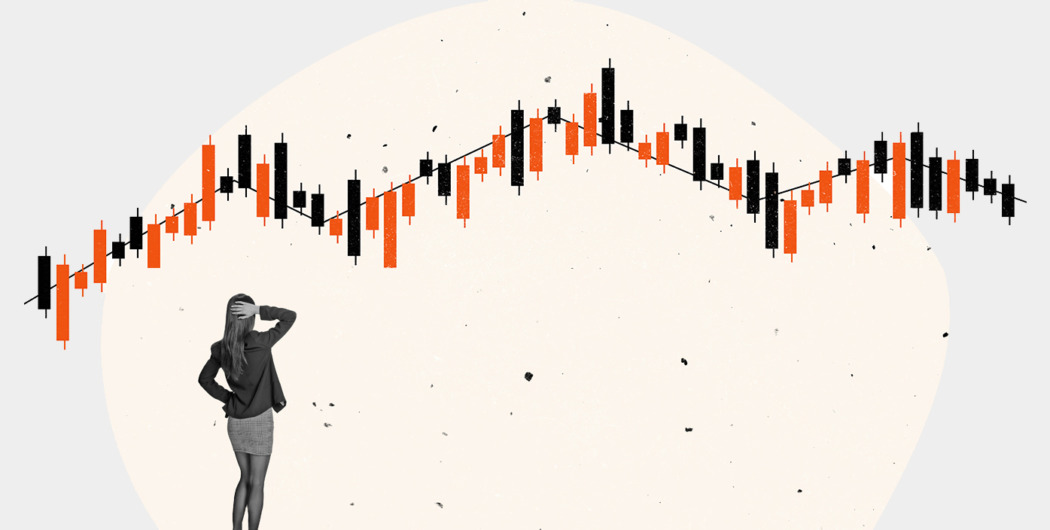

Out of the wide range of chart types, candlestick charting is the most popular and effective type that allows traders to interpret prices and emotions of market makers. If you know how to analyze a candlestick chart, you increase the chances of successful trades.
If you doubt this is true, look at Edson Gould, the most accurate forecaster with the longest track record. He used charts, market psychology, and some indicators to predict the direction of the stock market. He could foresee that Dow Jones would rise 400 points in the 20-year bullish market, it would hit 1,040 in 1973, and would top 3,000. The last prediction came true in 1991, four years after Mr. Gould died.
Candlestick charts can be used for various assets, including stocks, currencies, derivatives, commodities, you name it. Candlesticks are widely used in combination with the volume indicator for a more comprehensive technical analysis. Therefore, a volume candlestick chart type was developed. Keep reading to find out the differences between traditional candlesticks and volume candlesticks.
Background of candlesticks
In the 18th century, a businessman and rice trader, Munehisa Homma, noticed that traders’ emotions affected the price of rice. He invented the candlestick concept that would reflect those emotions and their impact.
Volume candlestick vs. Japanese candlestick
A usual candlestick involves data on open, high, low, and close prices, as the volume candlestick does.
A candle consists of a body that shows the difference between open and close prices. Shadows above and below the body are used to display the highest (upper shadow) and lowest (lower shadow) rates within a certain period (period of the timeframe).
The color and the composition of the real body and shadows reflect the momentum and direction of an asset’s price. The most common colors for bullish candles are white and green, while bearish candles are usually black or red.
The difference between a traditional candlestick and a volume candlestick is that the latter has information about the market volume represented in the width of the candle.
Calculation
Volume candlesticks feature five different components: volume, high, low, open, and close. Similar to regular candlesticks, low and high suggest the shadows on both ends, whereas the open and close describe the body of the candlestick. As for the volume, it determines the width of the candlestick.
When the volume is high, it will form a wide candlestick. Similarly, when the volume is low, the candlestick form will be very narrow. During calculation, a chartist will often color the volume bars red or green. This will help determine the down and the up period.
When making the calculation, candlesticks can be hollowed or filled. A hollow candlestick will suggest that the open was below the close. Filled candlesticks are the opposite: the open was above the close.
When calculating the charts, the volume gets normalized and turned into a percentage. This is necessary for the look-back period. For instance, if you have a three-month daily chart, you will divide each day’s volume by look-back total volume (i.e., three months). The box width will show the total volume percentage for that look-back period.
A day with a big volume will take more on the X-axis, whereas low-volume days won’t take as much. If the width is varying for different candles, it means that your axis is not uniform.
Sometimes, the time frames may extend for longer periods as a result of the wide candlestick. On the other hand, if you have narrow candlesticks with low volume, the weeks and timeframe will be shorter. It is essential to keep a close eye on the charts, to see how the volume progresses.

Candlestick Reversals
Volume candlestick charts may be used to validate a reversal pattern. The purpose of this reversal pattern is to offer a signal that the market direction is about to change soon. This is the complete opposite of candlestick continuations that suggest a trend will likely continue in the same direction.
Traders will get the “message” that can influence their next trading decision. When it comes to candlestick reversal patterns, it means that the momentum has been lost. A price that used to go higher will likely start going lower.
Breakout Validation
Breakouts are likely some of the hardest to trade with volume candlesticks. At the same time, they are among the most rewarding ones. The most important thing is to figure out when a breakout is real and when a professional is selling for a beginner trader.
To validate a breakout, you should look carefully at three things:
· The price break
· The pre-determined time for the new price zone
· Whether closing is the more appropriate solution or not
An upside breakout occurring at high volume is often more bullish in comparison to high-volume options. This is because upside breakouts have stronger demands and are not as likely to fade.
Not every breakout will be validated. You need to study patterns and characteristics yourself, to see what works and what doesn’t. In this respect, a volume candlestick can help you decide whether an expansion can become a breakout or not.
Application of volume candles
As it was mentioned above, the size of the width determines the level of volume. If the candlestick body is wide, the volume is high. If the body is narrow, the volume is low.
1. Price volatility
The first and simplest way to use volume candlesticks is to determine whether the market is highly volatile.
If candlesticks are narrow for a certain period, it’s a signal that traders show a low interest in an asset. Thus, the price is quite stable, and you can use this period to enter the market.
When there are several candles with wide bodies, it may be a sign that traders are interested in an asset. The color of candles will show you whether buyers or sellers prevail in the market. You can use this period to enter the market and trade in the trend direction.
2. Trend trading
Volume candles can help you to decide whether you should keep a trade.
If you trade in a solid trend, candlesticks are expected to have the same color and be wide. If candles with another color appear within a trend, you should analyze how wide they are. If they are thick, there is no point to worry. You can keep your trade open to receive more rewards. At the same time, if you see wide candles, it’s time to close your trade and exit the market as a trend may reverse soon.
3. Trend continuation
Volume candlesticks can be very helpful when entering continuation patterns and trading within a solid trend. In a robust trend, a pullback is a common thing. If you see that the price moves in a single direction for a period of time and there is a price reversal, you should evaluate the market conditions.
If there are continuation patterns on the chart, for example, rising/falling three methods, you can open trade within a trend. Imagine there is a strong bullish trend and a formation of the rising three methods pattern. You should place a stop-loss order slightly below the third candle of the pattern and open a buy position with a take-profit target at the level of the recent high. This strategy works for small timeframes.
4. Breakouts
Volume candlesticks can help traders who prefer the breakout trading strategy. The major drawback of the breakout strategy is that there is a high risk of fakeout (the price reverses back).
When applying volume candlesticks, you should check whether the candle after the breakout candle is wide and moves beyond the breakout one. This is a sign that the price will continue moving in the breakout direction. If the candle is narrow and can’t move further, there is a risk of a reversal or a price correction.
Final thoughts
Candlesticks include all necessary information a trader needs to analyze whether the market offers good opportunities for trade. If you know how to analyze the candlestick, you will get information about the level of interest in the asset at a given period, as well as who controls the market (bulls or bears).


