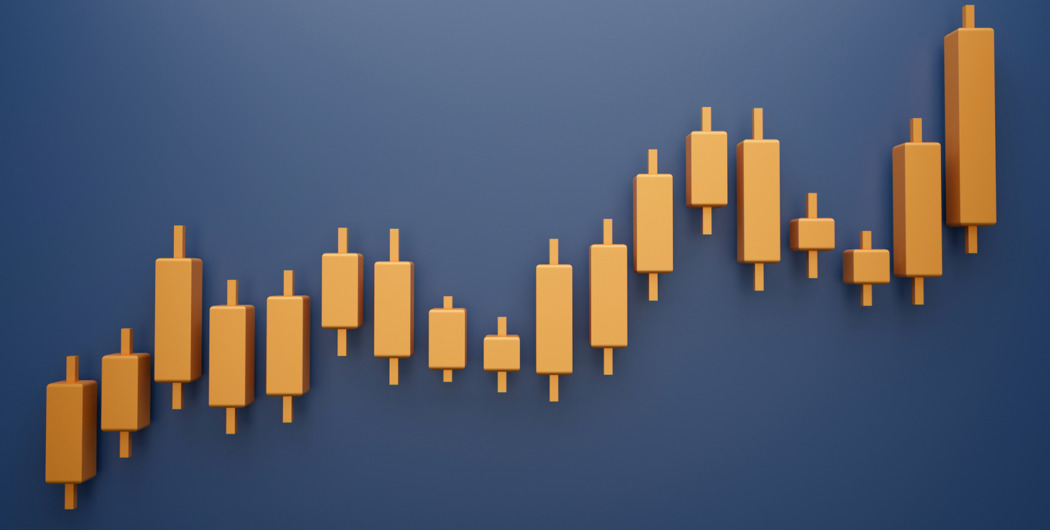

The candlestick chart is widely used by traders around the world. This chart type is popular because candlesticks reflect both the direction and intensity of the price movement within a certain period. If you know how to read a candlestick chart and its patterns, you will increase the chances of successful trades. In this article, you will find a comprehensive guide on what Japanese candles are and how to catch signals from them.
Earn profit in 1 minute
Candlestick Patterns
Candlesticks are technical charts that take data from multiple time frames, placing them in a single bar. They build patterns that can predict the direction of a price, both in the short and the long term.
Candlesticks use past and current price data to determine the movement. While they show a pattern, they are not exactly a future indicator. Day traders may use a variety of trading tools alongside it to get a more accurate prediction.
Effective strategies in your mailbox
Subscribe and discover a fund of trading knowledge
Great! Please check your email
We’ve sent you an email to confirm your subscription
Something went wrong
Try reloading the page. If that doesn’t help, please try again later
Japanese Candlesticks vs. Bar Charts
The main difference between bar charts and Japanese candlesticks is how they show direction. The bar will take a bearish form if the “Open” is at the top and the “Close” is at the bottom. If the opposite happens, the bar will be bullish.
Candlesticks have their direction determined by the color: red for downward and green for upward. The same thing happens with bars, but there are more nuances there. This makes candlesticks more convenient, as they are easier to read and have more visibility.

Japanese candlesticks are generally straightforward to analyze, making them popular among day traders. Most of the charts you will find online are candlesticks, so if you are a beginner in trading, you’ll have access to more resources.
Elements of a Japanese candle
A Japanese candlestick is a technical tool used to chart and analyze price movements. Although there are many types of charts, including bar, line, and point and figure, the Japanese candlestick is the most popular one.
Start from $10, earn to $1000
Although it’s believed it was developed back in the 18th century, it’s still the most effective chart type. It’s thought that the candlestick concept was invented by rice trader Munehisa Homma. He noticed that aside from the connection between the supply and demand of rice and its price, there was a strong impact of traders’ emotions on the rate of rice. The candlestick concept was introduced to the Western world in the “Japanese Candlestick Charting Techniques” book by Steve Nison in 1991.
You may be surprised that this concept was developed three centuries ago. However, you should remember that the first modern stock exchange was founded in Amsterdam in 1611. The Dutch East India Company became the first publicly-traded company and was the only firm with trading activity for many years.
As Mr. Homma determined that trader emotions affect an asset’s price, this was the basis of the concept.
A candlestick reflects market emotions by representing the size of price movements and their direction with different colors.
A candlestick shows the price’s open, close, high, and low points for a certain period. As trading is available on a wide range of timeframes, from 1-minute to 1-year, every new candlestick will stand for the period of the timeframe. If you are familiar with the bar chart, you may be confused about the difference between bar and candlestick charts.
The candlestick has a “real body,” a wide part that represents the difference between the open and close prices within a certain period.
If the price falls within a period of one candle, the open price is above the close one. The upper border of the body will stand for the open price, and the lower border will reflect the close price. If the price rises in a certain timeframe, the open price will be below the close price. The upper border of the body will reflect the close price, and the lower border will stand for the open.
This body is the most important part of the tool as it reflects:
- Price volatility. The size of the price movements is represented by the size of the body. If it’s small, it means the range between open and close prices was small, and the market was calm. If it’s big, it reflects the wide distance between the open and close prices, indicating increased price volatility.
- Price direction. The color of the body represents whether the open price was below the close (market rose) or above the close (market fell). The most common colors are green or white for bullish candles and red or black for bearish candles. You can always customize the colors, but it’s recommended to use the standard ones.
As it was mentioned above, the candlestick also reflects high and low prices. They are presented by so-called shadows or wicks. These are thick lines above and below the candle’s body. The upper shadow reflects the highest price within a certain period the candlestick stands for, while the lower shadow stands for the lowest price.
7 golden rules of trading
Everyone has their own trading style, but some principles are critical for success. Make sure you’re following these basic rules of trading.
Read more

Japanese candlestick: applications
The sizes of the body and shadows determine the appearance of a candlestick and allow traders to make conclusions about the strength of market participants and the upcoming price direction.
If the candle has a long upper shadow and a short (lack) lower wick, this means bulls couldn’t keep control over the market, and the trend is likely to reverse down soon. When the candlestick has a long lower shadow and a small (lack) upper wick, this reflects a situation when bears were too weak to pull the price further down. Thus, the trend may reverse up soon. There are candlesticks without upper (the highest price equals the open/close rate) or lower (the lowest price equals the open/close rate) shadows.
If the candle has a small body, it means there are uncertainties, as neither bulls nor bears could take control over the market.
Candlesticks allow traders to make decisions and apply a specific Japanese candlestick strategy based on an established pattern. The patterns provide signals on the short-term price direction. As candles are formed constantly, it’s impossible to catch alerts for long-term trades. Usually, patterns consist of one, two, or three consecutive candles. As a pattern forecasts a price direction, there are bullish and bearish patterns. You can learn the most popular candlestick patterns here.
When talking about candlesticks, chart patterns should be mentioned as well. These are formations on the chart that resemble certain shapes. For instance, there are triangle, cup-and-handle, head-and-shoulders patterns. They are clearly visible on candlestick charts.
Takeaway
The Japanese candlestick is the most popular and effective type of chart. It reflects trader emotions that significantly affect the price movements. The size and color of the candlestick show the price direction and its intensity, which makes market analysis easier. Moreover, candlesticks form patterns that are widely used to predict the upcoming price direction.
Trading with up to 90% profit
+1 <span>Like</span>