
Levels are a vital part of trading. To trade successfully, every trader should know support and resistance points. They determine how the price will behave in the future. Keep reading to learn what support and resistance levels are and which indicators can help you identify them.
Earn profit in 1 minute
Importance of levels in trading
You can’t build an effective trading strategy without knowing support and resistance targets. They are key points where the price is more likely to reverse. When a price touches a support level, it’s supposed to rise. When a price reaches a resistance point, it’s expected to fall.
You should also know about psychological support and resistance levels. These points are determined by trader psychology. According to statistics, people consider prices ending at 50 or 00 as vital reversal targets. Even though a technical tool doesn’t identify them as support or reversal points, traders still believe they are.
Traders can use support and resistance boundaries for reversal and continuation trades.
If the price turns around, a trader opens a position in a reversal direction. If the price breaks beyond the support or resistance level, it’s a sign the price may turn around.
Support and resistance points can be determined with various tools. Let’s consider the most effective ones.
Effective strategies in your mailbox
Subscribe and discover a fund of trading knowledge
Great! Please check your email
We’ve sent you an email to confirm your subscription
Something went wrong
Try reloading the page. If that doesn’t help, please try again later
Highs and lows
Support and resistance levels can be easily placed based on the points where the price rebounded last time.
Look for the latest close price where the price turned around. It will be a potential reversal point. The more often a price rebounds from a certain level, the more likely it will rebound from it again.
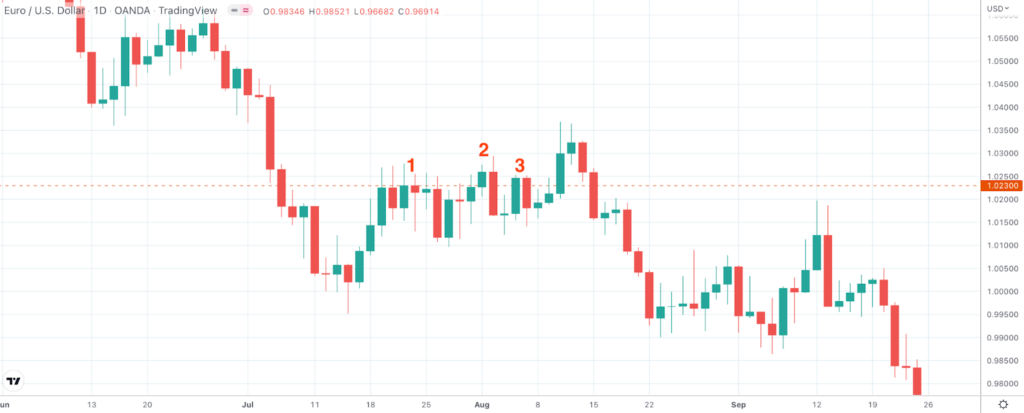
Look at the chart above. The price of the EUR/USD pair rebounded from the level at $1.0230 several times (1). Later, the price went slightly beyond it (2). However, it was still near $1.0230. After, EUR/USD stopped near $1.0230 again (3).
You should remember that it’s a common situation when a price goes slightly beyond support and resistance levels.
Trendlines
A market goes up, down, and sideways — trendlines frame price movements.
Start from $10, earn to $1000
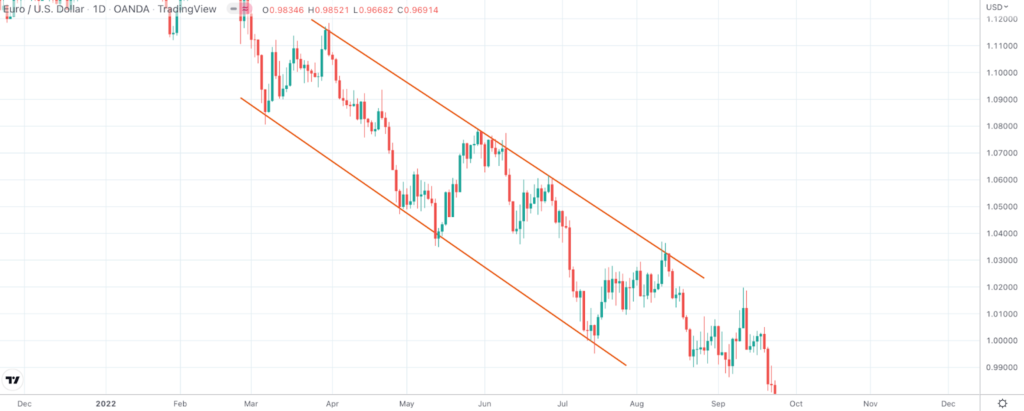
Trendlines are drawn through at least two points. The upper line becomes resistance. The lower band is used as support. The price is supposed to rebound from them and continue moving in the general trend.
Trader’s level test
Answer 7 short questions and define your level as a trader. Take the test now to evaluate your real knowledge!
Start test

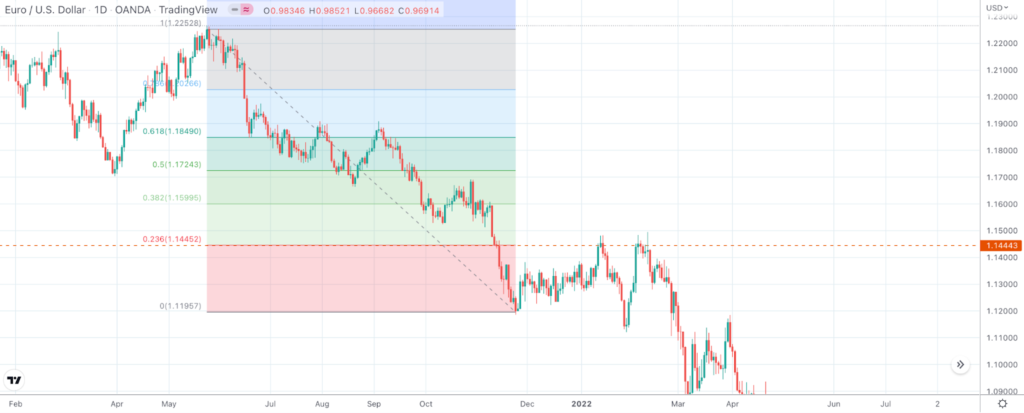
Fibonacci levels in trading
Support and resistance levels can be identified not only with instruments but with indicators. Fibonacci is one of the most popular ones. There are many types of Fibonacci tools. However, Fibo retracements are more common, especially for beginner traders.
It’s the standard instrument on any trading platform. All you need to do is to select it from a list of indicators and draw one line that will build support and resistance targets. The only challenge is to draw it correctly.
Remember that the line should connect the trend’s highest and lowest points. Draw the line from top to bottom in a downtrend. Vice versa, lead the line from bottom to top in an uptrend. Levels that will appear on the price chart will become targets for the price.
The most important points are 23.6%, 38.2%, 61.8%, and 78.6%. The 50% level is a psychological boundary.
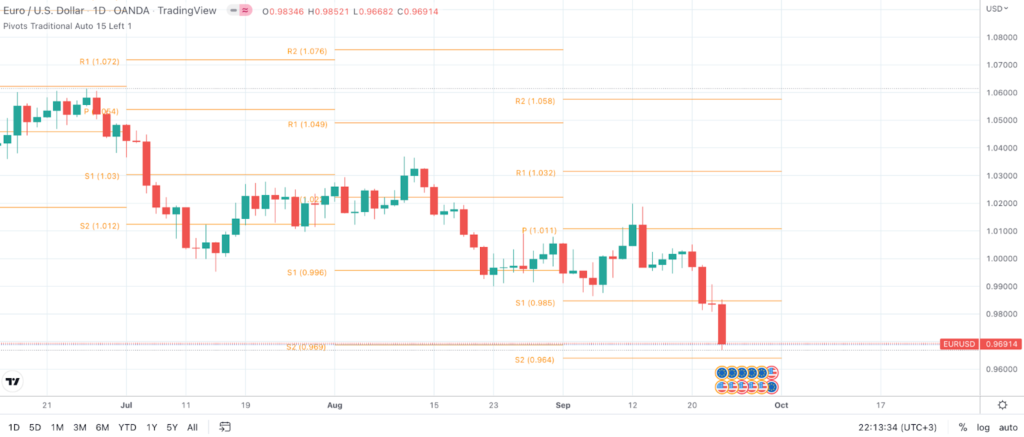
How to read pivot levels in trading
Pivot points are another indicator that traders widely use. It’s not a standard tool, but you can download and implement it easily. There are numerous types of this instrument. The most effective and simple one is traditional pivots.
The indicator consists of five levels. The pivot point is a middle line that determines whether the price will rise or fall. If the price is above the pivot point, it’s supposed to surge and target resistance levels one by one. When the price is below the pivot point, it’s anticipated to fall to support boundaries. Also, there are two resistance points and two support points.

The levels are built automatically after you implement the indicator on a price chart. However, they have a unique feature. When you trade intraday, you need to apply daily pivots. If you open a position on a daily timeframe, you should choose weekly pivots, etc.
Final thoughts
If you don’t know where the price is supposed to reverse, you won’t be able to trade successfully. However, when dealing with levels, you need to remember two things. First, they can be broken. It often happens because the market can’t constantly move in the same direction. Second, the price may go beyond them or might not reach them at all.
***
Ready to put new knowledge to practice? Then check out a video with our analyst Tony for some inspiration:

Tony is a financial analyst of the Binomo team. He is a trader with many years of experience in the market. Tony is the face of our YouTube and Instagram channels and is doing everything to help traders achieve new heights.
Trading with up to 90% profit
<span>Like</span>