
Trading indicators are one of the most important tools for every technical trader!
All professional traders use trading indicators as part of their strategy. You might be able to learn more about price trends if you use them in conjunction with the appropriate risk management techniques.
Let’s examine some of the most accurate trading indicators out there.
Earn profit in 1 minute
Explanation of trading indicators
Using technical analysis is an essential part of your trading strategy, and it can be beneficial whether you’re involved in trading forex, commodities, or shares. Trading indicators are calculations displayed as lines on a chart and can be used by traders to spot specific market patterns.
There are various kinds of indicators, including lagging and leading indicators. A lagging indicator examines historical trends and momentum, whereas a leading indicator is a predictive pattern that forecasts future price changes.
Effective strategies in your mailbox
Subscribe and discover a fund of trading knowledge
Great! Please check your email
We’ve sent you an email to confirm your subscription
Something went wrong
Try reloading the page. If that doesn’t help, please try again later
Most accurate trading indicators
You can apply your expertise and risk tolerance to determine which indicators are ideal for your strategy. Although not ranked, the trading indicators on this list represent some of the most accurate options for retail traders.
1. Moving average
This is a tool for determining a current market price trend’s direction without the distraction of more recent price spikes. The moving average (MA) indicator creates a single trend line by adding together the price levels of a financial asset over a predetermined time frame and dividing them by the total amount of data points.
The MA’s length determines the type of data used. A 200-day MA, for instance, needs data from 200 days. You can research resistance and support levels and view past price action by using the moving average indicator. This implies that you can predict potential patterns in the future.
2. Stochastic oscillator
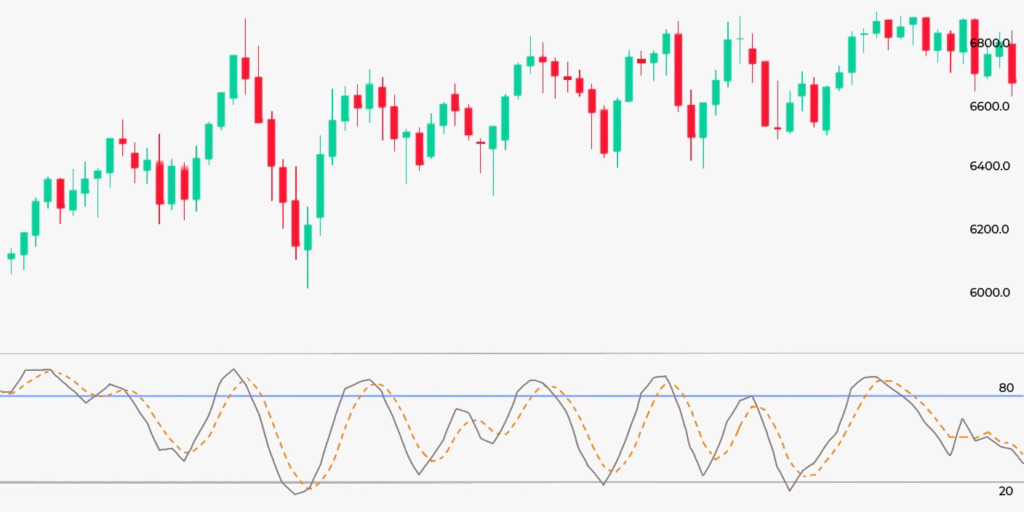
A stochastic oscillator is a technical indicator that contrasts a single asset’s closing price to a spectrum of its prices over a time frame, indicating trend strength and momentum. It uses a 0 to 100 scale. An oversold trade is often indicated by a reading under 20, and an overbought market by a reading over 80. However, a correction or rebound may not necessarily follow in the presence of a strong trend.
3. Bollinger bands
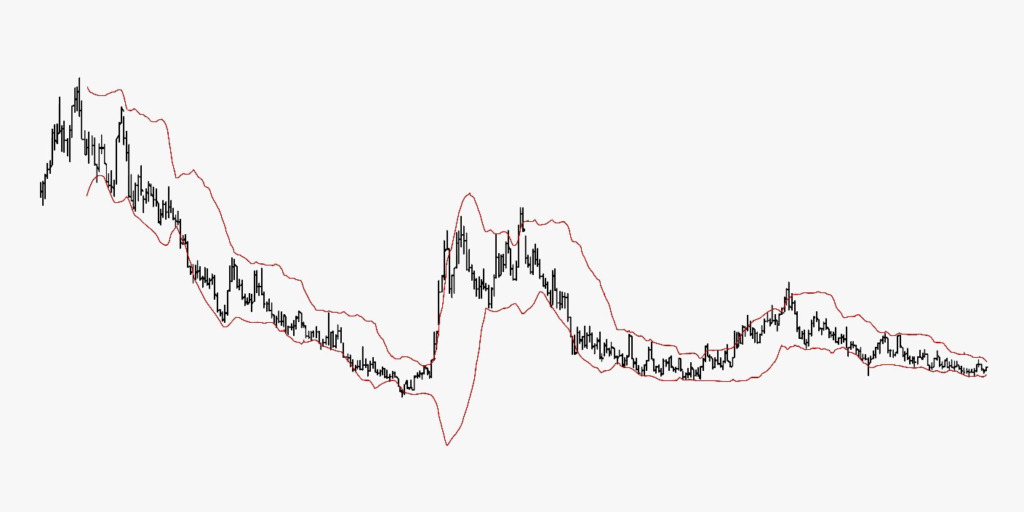
This trading indicator offers a price range where an asset’s price normally trades. The band’s width fluctuates to reflect the current volatility. The closer (or narrower) the bands are near each other, the less volatile the financial asset is regarded to be. The apparent volatility increases as the bands get wider.
Bollinger is generally employed as a way to identify long-term price changes. Still, they can also be useful for spotting when an item is trading out of its typical range. A price can be overbought or oversold if it consistently moves outside the upper and lower bounds of the band.
4. Exponential moving average
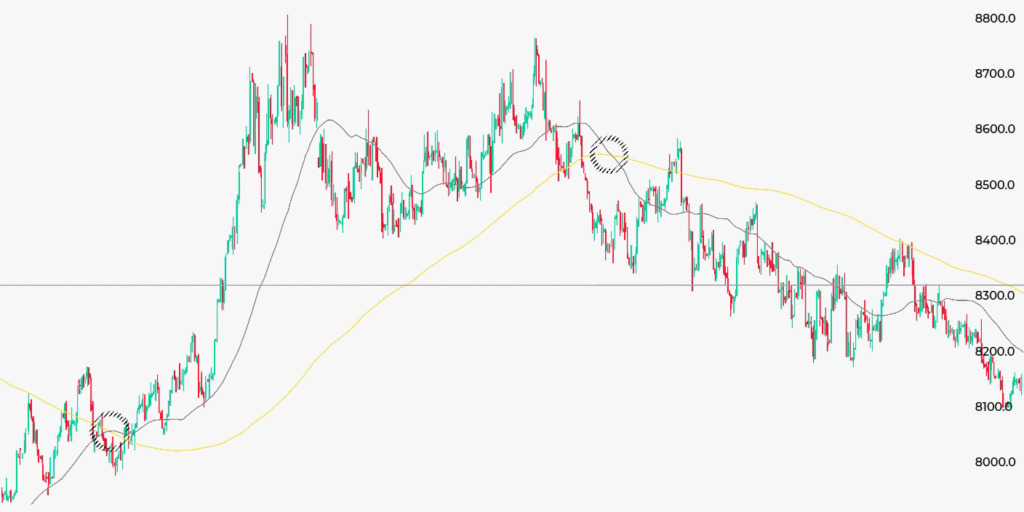
EMA is a different kind of moving average. It prioritizes the latest data points more heavily than the SMA (simple moving average, or MA) does, making data better receptive to new data. EMAs can assist traders in validating large market movements and determining their authenticity when used in conjunction with other trading indicators.
For short-term EMAs, the 12- and 26-day EMAs are the most widely used; for long-term indicators, the 50- and 200-day exponential moving averages are used.
5. Relative strength index
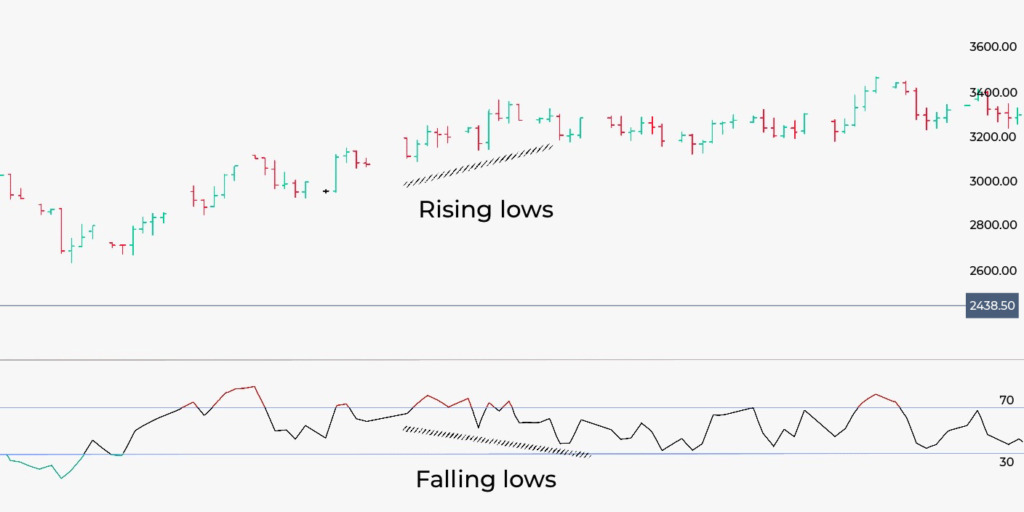

Traders primarily employ RSI to aid in the identification of market conditions, momentum, and warnings for possibly dangerous price fluctuations. An integer between 0 and 100 is used to represent RSI. An asset near the 70 level is usually seen as overbought, whereas an item at or near the 30 levels is usually regarded as oversold.
An overbought signal indicates that assets may be due for a market correction and that recent gains may be maturing. An oversold signal, on the other hand, would indicate that recent declines are approaching their maturity and that assets are likely to rise.
How to start trading with $200 and minimum risk
Don’t let a small budget deter you from trading! Learn how to start trading with $100 or $200 and make the most out of this money!
Read more

Conclusion
Trading indicators are essential tools that all traders should be familiar with. However, how you use a trading indicator will determine its effectiveness. To maximise the likelihood of a market movement, traders usually use many indicators with varying parameter settings.
It would be best if you, however, are careful not to use too many indicators simultaneously, and also, don’t forget that successful trading doesn’t happen overnight. So it would be best if you do not put yourself under too much pressure to make it without passing through learning, relearning, and unlearning.
Trading with up to 90% profit
+1 <span>Like</span>