
Did you know that the market price spends about 70% in flat mode? This period is the most favorable for novice traders to enter the market. This is because the price trades within certain boundaries represented by support and resistance levels. But how to define a “flat” market?
Trading with up to 90% profit
What is flat trading?
When a market or security does not rise or fall in price, it’s called a flat market. That is, the price moves sideways. “Flat” implies the absence of long and short positions. For a better understanding of periods of flat trading, you should refer to flat indicators.
Technical indicators are mathematical models based on historical data. They are used by traders to predict future price trends and make trading decisions accordingly. Using a mathematical formula, a technical indicator obtains a series of data points from previous prices and volumes.
Flat indicators help identify the periods when the price volume is low and neither bulls nor bears can take control over the market. These indicators also provide an opportunity not only to trade during a flat market but also to determine the formation of a trend at an early stage.
Read on to learn about some effective flat indicators.
Effective strategies in your mailbox
Subscribe and discover a fund of trading knowledge
Great! Please check your email
We’ve sent you an email to confirm your subscription
Something went wrong
Try reloading the page. If that doesn’t help, please try again later
Bollinger bands
The first indicator to be aware of is Bollinger Bands. Graphically, Bollinger Bands are three lines: a moving average in the middle, which characterizes the main direction of the price movement, and two lines that limit the price chart on both sides and characterize its volatility. They are plotted at a standard deviation above and below a simple moving average.
The main parameters of this indicator are the time period and standard deviation. Each of these parameters can be changed depending on the chosen strategy.
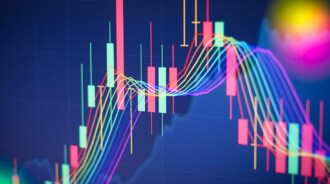
Since the value of the standard deviation depends precisely on volatility, the bands on the chart adjust their width themselves: the distance between the bands can both increase during periods of market instability and decrease during periods of stability (flat trading).
It is important to emphasize that Bollinger Bands should capture about 95% of the prices inside these bands and only 5% outside them.
ADX
ADX, or Average Directional Movement Index, was introduced back in 1978 and is still relevant and frequently used. On the chart, this indicator is located in a separate area, and ADX values range from 0 to 100. Most often, the indicator does not rise above 60.
Earn profit in 1 minute
Usually, it is represented by one line, but it may include two special lines that are needed to identify buy and sell signals. These are Plus Directional Movement Indicator (+DMI) and Minus Directional Movement Indicator (-DMI).
The ADX itself is used by investors and traders to determine the absence or presence of a trend. The trend is considered “thick” if the line is below the 25 level. In this case, you should use range-trading strategies. Numbers above 25 reflect the growing strength of the trend.
Cryptocurrencies: what to expect in 2023
2023 is expected to be the year of recovery for the crypto market. Read on to see what to expect in 2023 for cryptocurrencies.
Read more

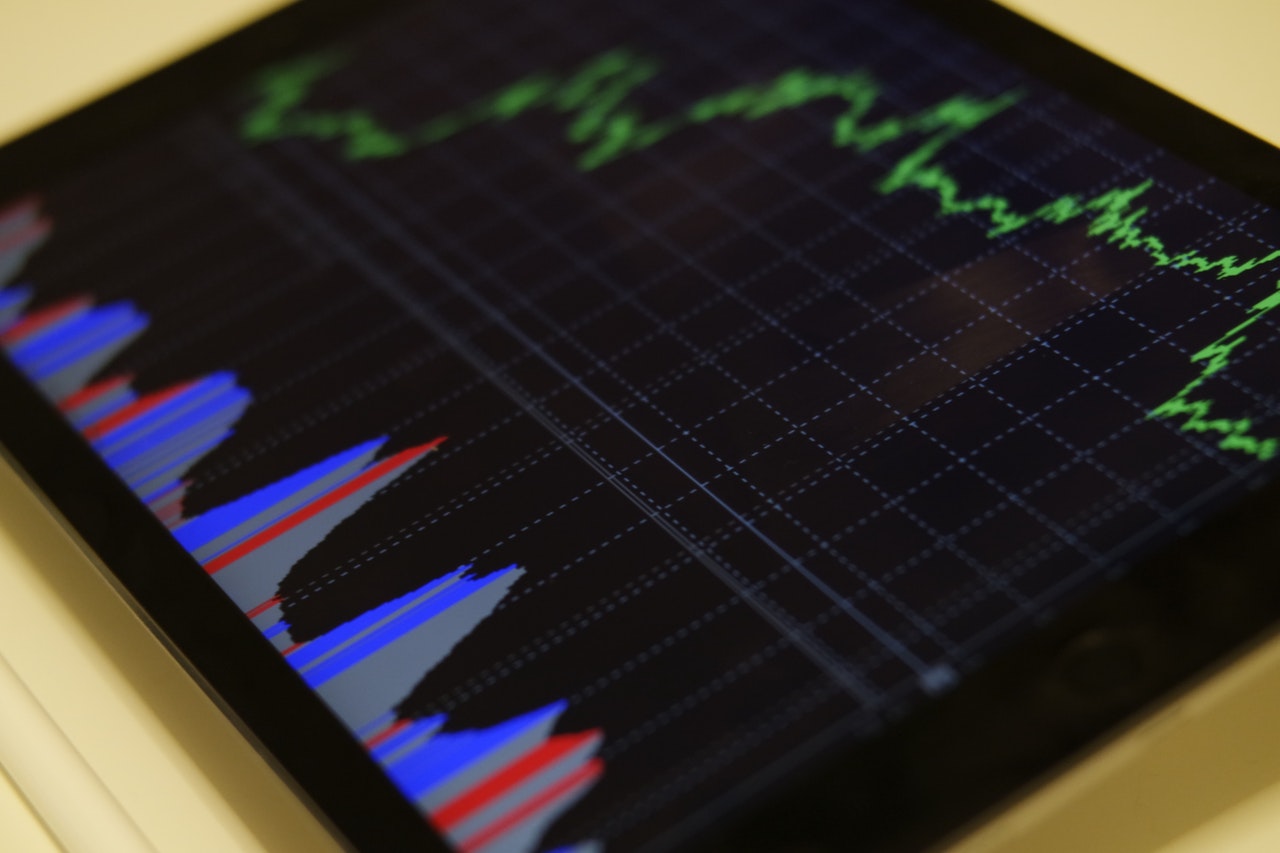
Flat pulse indicator
Another indicator worth mentioning is the Flat Pulse Indicator. It looks like a histogram with bars of different colors and sizes. The size of the bars and the coloring of the zero level reflect the periods of both flat trading and strong trends along with the direction of trends.
The green color of the zero line indicates the presence of a flat, and the yellow color indicates a trend. The blue bars show an uptrend, and dark blue or purple represents a trend change. A downtrend is shown in red bars, and a change in the downtrend is colored in burgundy. You can determine the strength of the price movement by the bar height.
This indicator is convenient because you can either use the standard settings or create it for yourself and your trading strategy.
The simplest use of the Flat Pulse indicator is to track the dynamics of its histogram in order to determine the best moment to enter the market.
Aroon
Another example of a flat technical indicator is Aroon. Traders use it to determine the change in a trend, as well as its strength.
The indicator consists of two lines, one of which measures uptrends and the other measures downtrends. An up line, also called “Aroon up,” measures the number of periods since the recent high. A down line or “Aroon down” measures the number of periods since the recent low.
Aroon’s main parameter is the period of time between highs and lows. The indicator moves between values from 0 to 100.
The position of both indicators below 50 can signal the consolidation of prices. Neither new highs nor new lows are created. Traders watch for breakouts and the next Aroon cross to signal which direction the price is moving.
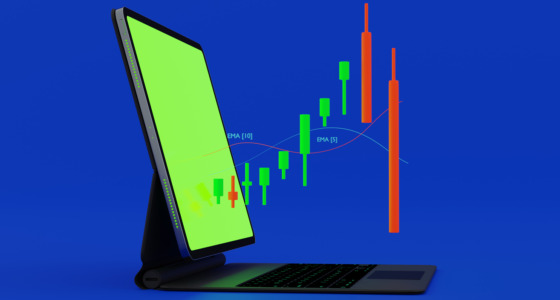
Moving Average indicator
The Moving Average indicator is perhaps one of the most famous ones, but also one of the simplest indicators you can use. This measurement shows the average price indicator for a certain period.
Moving averages come in various types, including:
– Exponential
– Simple
– Linear weighted
– Smoothed

No matter which type of Moving Average is used, it can show an average price’s dynamics throughout a certain time. The only different thing is the calculation for each. In some cases, the indicator can also be used as a base for other indicators that are more complicated.
If you look at a price chart, you will see the Moving Average as a line. You’ll be able to tell the trend direction by the way the MA moves. If it’s growing, it indicates an uptrend, whereas if it’s declining, it indicates an uptrend.
Fibonacci indicator
The Fibonacci indicator is quite popular, and most people are aware of it thanks to the number sequence of a famous mathematician, Leonardo of Pisa, who was known as Fibonacci.
The Fibonacci indicator can be used on a price chart, and it appears as a grid of multiple correction levels. Many traders use this indicator to figure out where to take market entry orders, stop-loss orders, and profits. More often than not, Fibonacci levels are calculated following the movement of a market up or down.
This indicator finds presumed correctional levels by taking advantage of the relations of the 23.6, 38.2, 50.0, 61.8, and 76.4 number sequences. 38.2, 50.0, 61.8 are said to be the strongest correctional levels.
When using this indicator, a Forex trader has to pick a strong complete price impulse that can have Fibonacci levels applied to it. Afterward, all the trader has to do is wait for the particular correctional movement to end on one of these levels, then join the trade in the initial impulse direction.
Relative Strength Index (RSI) indicator
The Relative Strength Index indicator represents a momentum oscillator that can measure the price movement speed and changes. It was created by J. Welles Wilder, and it can show you a price’s position compared to a preceding period. So, it can tell you whether the price has had fluctuations from its average values and how far it went. The oscillations of the RSI range from 0 to 100.
You can have the RSI indicator calculated under your price chart, in a separate window. The 30, 50, and 70 levels are singled out when you want to track the trading signals. Selling can be done once the indicator reaches the area above 70, which is also known as “overbought”. Meanwhile, when the indicator is under 30, which is known as “oversold”, we can look for opportunities to buy.
You should know that the RSI may stay in oversold or overbought status for longer periods during very strong trends.
MACD indicator / Moving Average Convergence / Divergence

Gerald Appel designed the MACD in 1979. This indicator is based on the Moving Average one, as you can already tell from its name. However, other parameters were also taken into consideration.
Similar to the RSI, you can see the MACD under your price chart in a separate window. There are two lines that make the MACD indicator and one of them is a histogram.
An extreme value divergence of the indicator and price chart is one of the strongest signals on this indicator. Extreme values can either be minimums or maximums. When you see such a signal, it signals the movement of a price at a market reversal or the beginning of a correction.
Ichimoku Kinko Hyo indicator
Goichi Hosoda created the Ichimoku Kinko Hyo indicator back in 1926. Ichimoku was also his pen name – that’s why the indicator was named after him. It appears on the price chart, with crossings of the lines Kijun-sen and Tenkan-sen being the main trading signals.
The indicator has five lines, each with its own calculation formula. Two of these lines constitute what is known as the Ichimoku Cloud. Aside from the Tenkan-sen and Kijun-sen main trading signals, the bounce off or break out of the Cloud boundary created by the Senkou Span B and Senkou Span A lines is also a main trading signal.
You should use candlestick analysis with the Ichimoku indicator for the best trading results.
Parabolic Sar indicator
The Parabolic Sar indicator has been around since 1976 when J. Welles Wilder invented it. SAR is short for “Stop and Reverse”.
In the chart, the indicator resembles a parabola, and it can track trend movements while offering great signals for the trend’s end.
You can see this indicator represented on the chart by different dots. The trend is ascending when it is above the dots, and it is descending when it is below the dots.
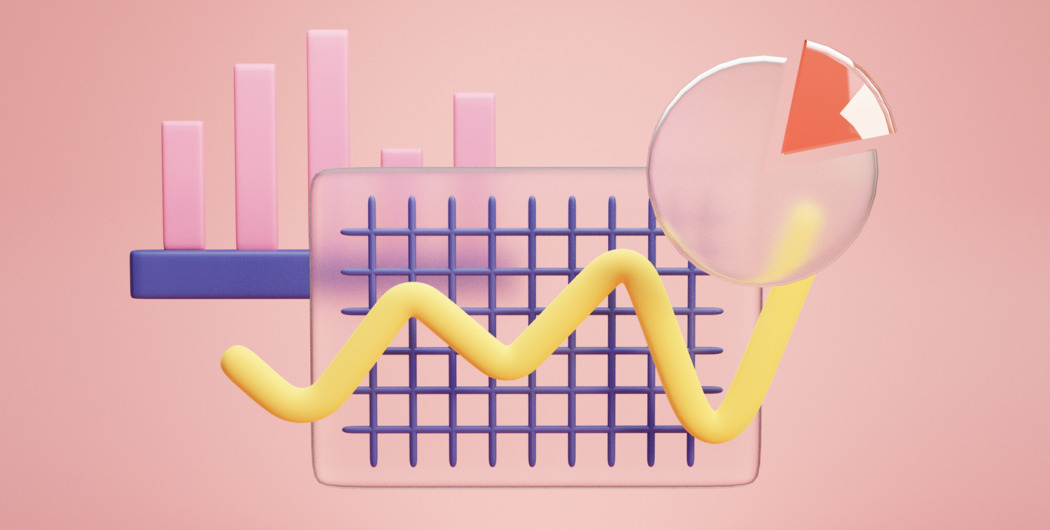
Pivot Points indicator
Henry Chase created the Pivot Points indicator. It is used to calculate specific price levels according to how the price changed during the preceding trading periods.
On a chart, a grid of different price levels is used to calculate the indicator, respectively the support levels S1, S2, and S3, the main Pivot level, and resistance levels R1, R2, and R3.
Alligator indicator
Bill Williams is the one behind the Alligator indicator. This indicator is based on three different SMAs. Every single SMA represents the teeth, lips, and jaw of an alligator, which is why the indicator has this name.

This indicator sits right on the price chart, and it is represented by three lines in different colors. When a price consolidates in a small range, you will notice the alligator beginning to open its mouth, with the three lines moving based on the trend.
Summing up
Flat trading implies that there is no definite trend. It is generally accepted that it is easier to trade in a trend, but flat trading occurs within certain boundaries that serve as support and resistance. For novice investors, such trading is easier because they can determine clear levels from which the price will rebound.
The indicators themselves help to determine correction periods when price volume is low, and neither buyers nor sellers can take control over the market.
But despite the various advantages of indicators, you should not rely on them entirely when making decisions regarding your assets. Data can have errors, so it is important to be able to correctly analyze and interpret it. When analyzing the market, you should use at least two indicators or, for example, an indicator and a pattern. Indicators need to be calculated in different ways (different data should be measured) so that their signals do not coincide.
Start from $10, earn to $1000
+4 <span>Like</span>