

A simple moving average (SMA) is a technical indicator that is used by itself and to build many other indicators—for instance, Bollinger Bands and MACD. Interestingly, the indicator was first described over 100 years ago. In 1909 G. U. Yule presented the “instantaneous averages” that R. H. Hooker calculated in 1901.
Although SMA provides delayed signals, it’s widely used by traders. Let’s discover why traders like the simple moving average.
Trading with up to 90% profit
What is a simple moving average?
A simple moving average is a lagging indicator. This means it follows a price, so signals occur with a delay. Therefore, traders prefer using this tool on medium- and long-term timeframes. The indicator consists of one line. However, most signals are based on an interaction of two or three SMAs with different periods.
Effective strategies in your mailbox
Subscribe and discover a fund of trading knowledge
Great! Please check your email
We’ve sent you an email to confirm your subscription
Something went wrong
Try reloading the page. If that doesn’t help, please try again later
How to calculate SMA?
The SMA is calculated using a price type and a period. For example, one of the most common period settings is 50, and the most common price type is close. It means you need to add up close prices for the last 50 candles. After, you need to divide them by 50.
When you apply the SMA automatically on the price chart, you only need to choose its period. The most common medium- and long-term trade periods are 50, 100, and 200. For short-term trades, you should use 9, 14, and 21.
How to start trading with $200 and minimum risk
Don’t let a small budget deter you from trading! Learn how to start trading with $100 or $200 and make the most out of this money!
Read more

SMA trading strategy
The SMA indicator provides three signals.
1. Trend trading

Traders use the simple moving average to identify long-term trends and trade on their reversals. To determine a long-term trend, you should use a 50-, 100-, or 200-day moving average.
The chart below shows that in an uptrend, the price moves above the 200-day MA; in a downtrend, it breaks below the SMA.
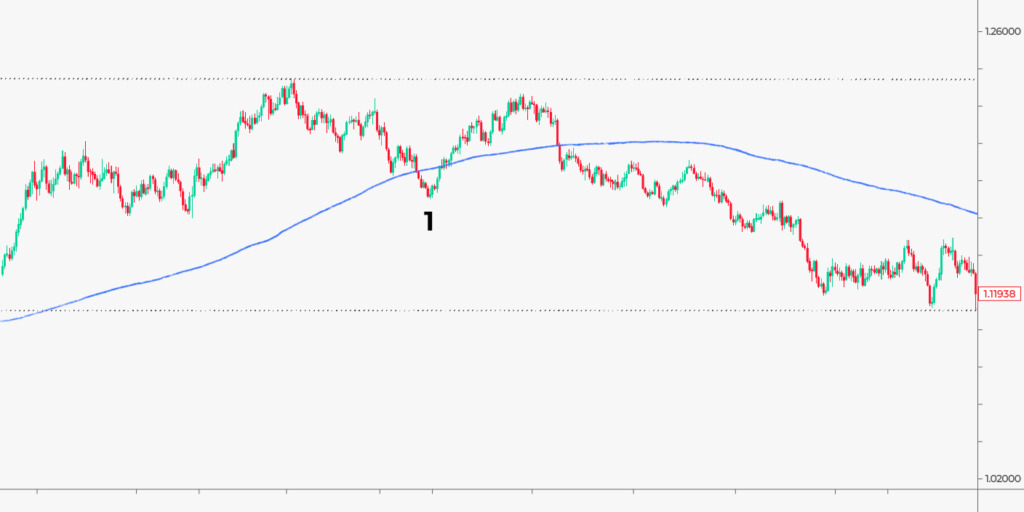
It means you can expect the price to form a new trend after the price changes its direction regarding the SMA.
Although the price may return to the current trend, as in the picture above (1), you can expect a trend change as soon as the price interacts with the SMA.
It’s recommended to close a buy position in an uptrend after a price falls below an SMA and close a sell trade in a downtrend after a price rises above an SMA. Although it may take several weeks for a price to form a new trend, you risk missing a trend reversal if you don’t exit the market.
2. Support and resistance
Sometimes the SMA is used as a support and resistance level. It’s a common use case for short- and medium-term timeframes. This signal doesn’t work well on long-term timeframes because a price and an SMA rarely interact there.
The chart below shows the 30-minute timeframe of the EUR/USD pair and the 21-period moving average. In some cases, the SMA served as support or resistance level (squares); in others, it didn’t (circles).
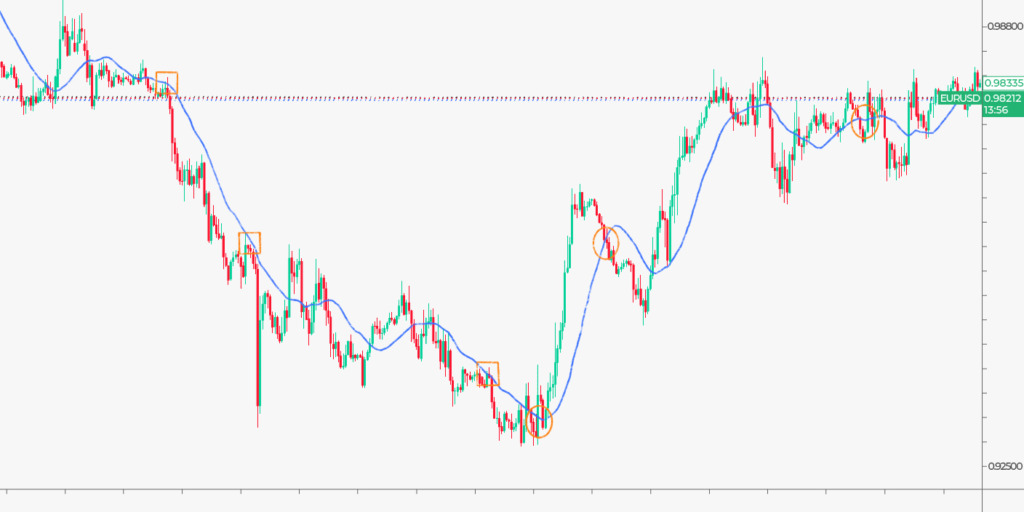
It happens because the SMA can reflect a trend change. You need to combine such signals with other technical tools to use the SMA as a support or resistance level. The best is to draw support and resistance boundaries based on the latest highs and lows. If the SMA moves through them, it’s a strong signal.
Also, remember that the lower timeframe is, the smaller period the SMA should have.
3. Crosses
The most common signals the SMA provides are a death cross and a golden cross. They alert on a trend change. To trade crosses, you need to combine two SMAs with different periods. For instance, you can use 50- and 200-period MAs for longer-term timeframes and 9- and 21-period MAs for short-term trades.
- Death cross. When an MA with a shorter period falls below an MA with a longer period, it signals a solid downtrend.
- Golden cross. When an MA with a shorter period rises above an MA with a longer period, it’s a sign of a solid uptrend.
The chart below shows that when the 50-day MA fell below the 200-day MA (1), the bearish trend came into force. There could be a death cross earlier (0), but the 50-day MA didn’t fall below the 200-day MA.
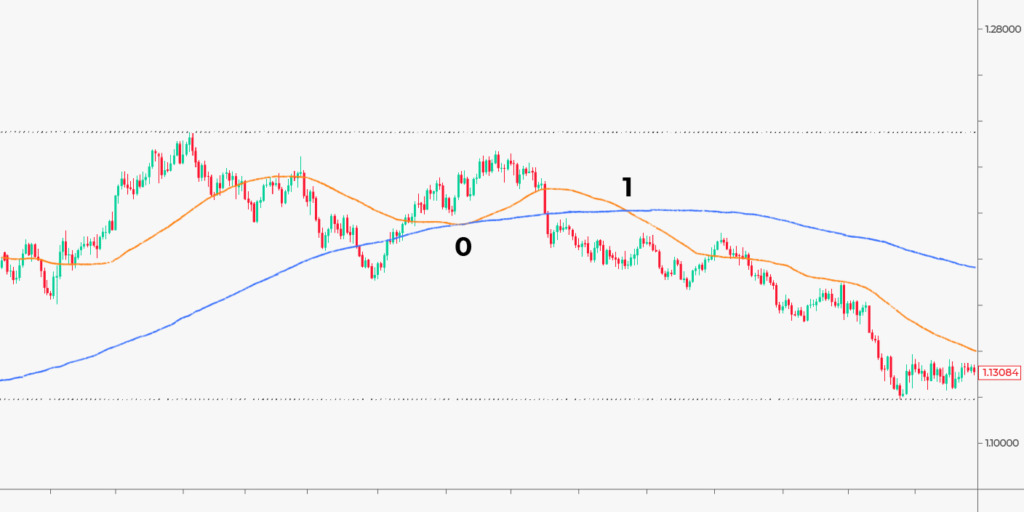
After a crossover occurs, you can open a trade. To exit the market, you should use other indicators or support and resistance levels based on the latest highs and lows.
Takeaway
The simple moving average is a useful indicator. However, it’s not very accurate because it provides delayed signals. To trade with the SMA, apply standard trading rules, including stop-loss and take-profit orders.
Start from $10, earn to $1000
+2 <span>Like</span>