Some beginners rely solely on their intuition when trading, but that is a common mistake. As a rule, more reliable trading results can only be achieved after conducting thorough technical analysis. We have prepared some interesting information that will help you understand the topic and predict price fluctuations more accurately.
Trading with up to 90% profit
Key meaning
In simple terms, explaining what is technical analysis, we can define this term as follows: it’s a rational way to predict the price movement on any chart. The main application of this method is trading in the markets of cryptocurrencies, securities and other assets.
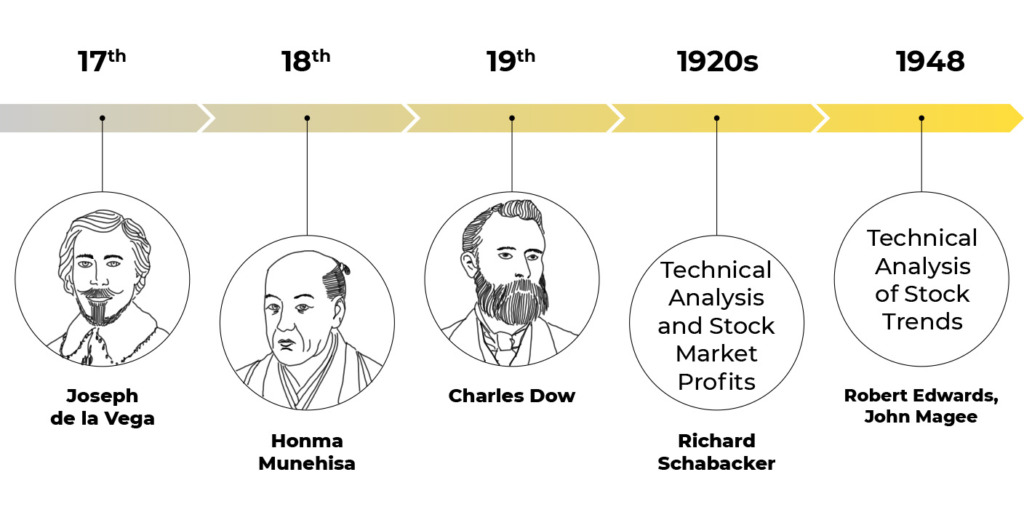
These were the main historical stages of the emergence of technical analysis of stocks:
- some TA elements were developed by Joseph de la Vega in the 17th century for trading in the Dutch markets;
- in the 18th century the Japanese rice trader Honma Munehisa developed the well-known Japanese candlestick chart;
- in the 19th century Charles Dow created the Dow Theory that became the basis for modern TA;
- in the 1920s, Richard Schabacker published several books on TA, combining innovative information with basic principles founded by Charles Dow and Peter Hamilton.
Technical Analysis of Stock Market Trends by Robert Edwards and John Magee, published in 1948, is considered a seminal book among traders to this day and is still reprinted by the Amacom brand.
Effective strategies in your mailbox
Subscribe and discover a fund of trading knowledge
Great! Please check your email
We’ve sent you an email to confirm your subscription
Something went wrong
Try reloading the page. If that doesn’t help, please try again later
Technical analysis industry

Don`t assume that stock market technical analysis is for amateurs because there are specialized organizations that deal with TA at the industry level. Vivid examples include:
- International Federation of Technical Analysts, IFTA
- Market Technicians Association, MTA (USA);
- American Association of Professional Technical Analysts, AAPTA (USA).
There are similar organizations in every country where the trading industry is actively developing. In addition to the United States, the largest technical analysis investing schools exist in Canada, Australia, Great Britain, France, and so on.

How do you conduct TA?
The first attempts to study TA are usually unsuccessful, because the trader is overwhelmed with information. It’s true, but actually there are three key axioms to start with:
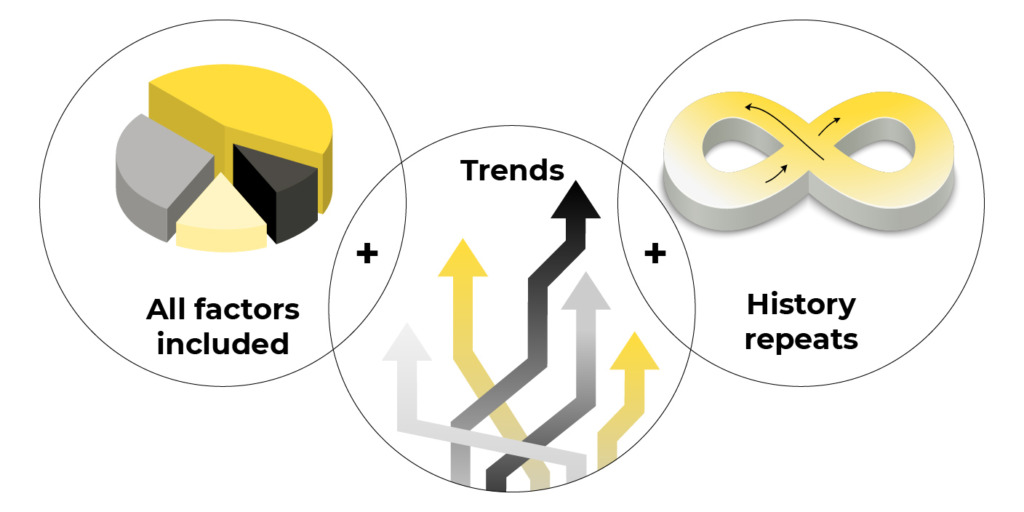
- Each factor that can affect the asset’s price is already included in the chart. That is, even if the user knows absolutely nothing about the economic condition of a company and its financial performance, it is possible to accurately predict the price movement.
- Price changes are always driven by trends. That is why the main part of the technical analysis of the financial markets strategies is based on trends. In order to most rationally understand the situation, a trader should understand the direction of the trend, its lines and channels, as well as recognize the importance of support and resistance lines. Also, users should not forget about the magic of round numbers and volumes when analyzing trends.
- The history of price movement always repeats itself. As the main trading theories say, “what happened once will happen again,” thus price fluctuations are cyclical in nature and are repeated over and over again. This is the main reason why 10-, 50- and 100-year-old trends still work (like “W” trend reversal pattern).
The key advantage of TA is that it is relevant for any type of asset: from currency pairs and indices to futures and commodities. In addition, technical analysis, unlike fundamental analysis, requires only an understanding of the price movement. The second type also requires studying price fluctuations in accordance with the company’s balance sheet, working capital balance, financial statements (profit/loss) and so on.
Conclusion

After studying this information, readers should have a detailed understanding of the technical analysis meaning in trading. Most of the strategies for successful buying and selling of assets are based on the principles of TA.
Its key advantages are versatility and the opportunity it provides to quickly and precisely enter the market. In addition, knowledge of TA allows you to draw conclusions from any type of chart in just a couple of seconds. Thus, if you are considering short-term or medium-term deals lasting up to several months in the stock market, we definitely recommend mastering TA.
Start from $10, earn to $1000
+1 <span>Like</span>