

The story of Netflix’s breakout in 2013 is a prime example of why you need to spot trading opportunities in time. For nearly two years, the company’s stock price was stuck in a range between $50 and $130. But then, in October of 2013, Netflix released a game-changing earnings report, and the price had soared to $389 by the end of the year.
This is where using the right tools to spot such opportunities becomes crucial. If you want to learn more about breakout strategies and what indicators to use, read on.
Start from $10, earn to $1000
In short: what is a breakout strategy?
A breakout strategy is a popular trading approach that involves identifying and taking advantage of significant price movements in financial markets. The goal is to capture the gains that occur when the price breaks through a key level of support or resistance. These are price points where the asset has previously bounced off. For example, if an asset has been trading between $50 and $60 for several months, a breakout would occur if the price rises above $60 or falls below $50.
When the price breaks through a key level, it suggests that there has been a significant shift in market sentiment. In a short while, you may be seeing a rush of buying or selling activity among traders.

Traders who use breakout strategies are searching for big price movements in financial markets. These events can be triggered by external factors like news or economic data or internal factors like a company’s management or financial performance.
Effective strategies in your mailbox
Subscribe and discover a fund of trading knowledge
Great! Please check your email
We’ve sent you an email to confirm your subscription
Something went wrong
Try reloading the page. If that doesn’t help, please try again later
Importance of using indicators in breakout strategy
In a breakout strategy, traders will often use indicators to identify potential breakouts and confirm the validity of a breakout. Without them, you would have to rely solely on your interpretation of price action. And this can be subjective and is prone to errors.
If you want to have a quantitative and objective measure of market conditions, you can’t do without indicators. Sure, indicators alone may not provide a complete picture of the market. But when used properly and in conjunction with other forms of analysis, they are a source of valuable insights.
Depending on the type of indicator, the tool can help you identify support and resistance, the strength of the market trend, or some other information.
Four best breakout indicators for traders
Here are the four best indicators that every breakout trader needs to know:
Trading with up to 90% profit
Volume indicator
Volume is a good indicator to confirm a breakout, as it provides insights into the strength or weakness of a price movement. The indicator will tell you whether the price movement is sustained and or will likely return to its previous trading range.
When an asset price reaches established levels of support or resistance, the volume should increase because there will be more active traders in the market. If the volume doesn’t pick up at these levels, it signals that the breakout is not strong. Without volume, it’s likely to be a fakeout.
MACD
One of the possible use cases is if you expect a breakdown of resistance, look at the MACD—and if the indicator rises above 0, this may be a confirmation that the asset is going to experience further growth and vice versa.
You can also use the divergence between the price and the indicator. If there is a bullish divergence on the chart and the price is near the resistance, it may confirm the upward breakout. And if it’s bearish and the price is near the support, the reading confirms the downward breakout.
Bollinger Bands

Using Bollinger Bands for breakouts is based on the idea that the vast majority of closing prices should fall within the bands. If you’re in need of a quick recap, these are two standard deviations away from a simple moving average, and they create a channel of volatility around the price. An asset’s price breaking outside the Bollinger Bands is rare, so this event would point out potential buy or sell signals.
When the price nears a support or resistance level and the bands widen, it indicates higher market volatility and a potential breakout.
RSI
Typically, traders look for RSI crossovers to signal potential trades. But in this case, the indicator can be used to confirm a breakout.
If the price breaks through resistance, confirm the breakout by observing RSI moving from oversold territory (above 30). This tells you that the market momentum is up, and RSI is reflecting the change of the trend. Similarly, if the asset breaks through support while heading downward, you’ll want to confirm it with RSI that drops below 70 (overbought zone).
5 best coffee types for traders
Coffee is a great beverage for traders. A few daily cups of coffee improves the mind and enables you to make better trading decisions. Check it out!
Read more

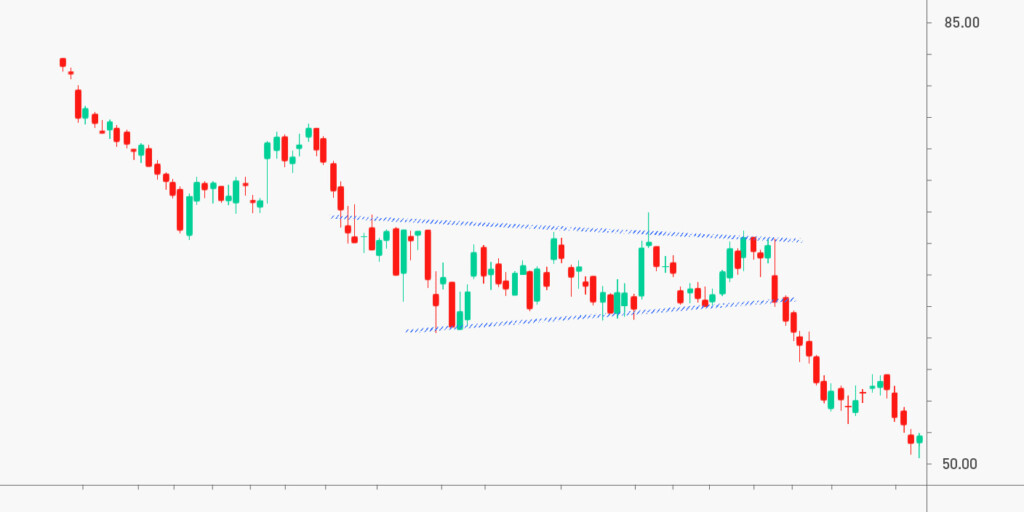
How to trade real breakouts
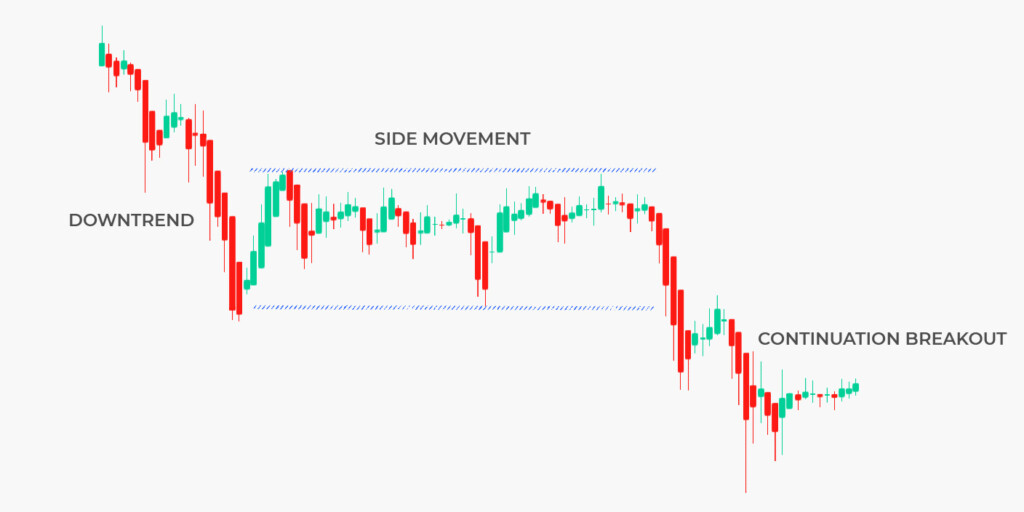
Let’s say you want to trade in a range-bound market. Here are the key steps to trading real breakouts in such a market:
- Identify the range. Look for a market that has been trading in a range between a support and a resistance level.
- Wait for a breakout. Wait for the market to break beyond either the support or the resistance level, or use technical indicators to determine when the breakout is about to happen.
- Enter the market. After the breakout, the market is likely to experience increased volatility as traders react to the new price level. This is a good time to enter the market, buying if the breakout is above resistance or selling if it’s below support.
- Use a stop loss. Place your stop loss just below support (if you’re going long) or just above resistance (for short sellers).
- Manage your position. If the market continues to move in your favor, you can lock in profits and use trailing stops to ride the trend. However, be prepared to exit the market in the case of a reversal or if the market moves back into the range-bound pattern.
How to avoid false breakouts
False breakouts can be frustrating, and they can also be costly. Here are a few recommendations to improve your analysis accuracy:
- Multiple timeframes – For example, if you identify a potential breakout on the daily chart, consider looking at the hourly or 4-hour chart to confirm it.
- Consider volatility – When the market is quiet with low volatility, it can increase the risk of false breakouts. It may be better to wait for higher volatility periods when trading breakouts.
- Use price action analysis – Look for price action clues like candlestick patterns, chart patterns, etc.
- Go beyond technical analysis – Pay attention to fundamental factors, i.e., the overall health of the economy, political events, and other news that could impact the market.
Takeaway
There isn’t one specific indicator that’s considered the “best” for breakout strategies. Instead, traders should use a combination of indicators to spot and confirm potential breakouts. Each of the recommended indicators – Volume, MACD, Bollinger Bands, and RSI – has its own strengths and weaknesses, which ultimately help them provide different insights into market trends.
Sources:
Breakout trading definition, BabyPips
Using trading indicators effectively, Investopedia
Earn profit in 1 minute
+3 <span>Like</span>