
Newbies wonder what time frame they should choose for candlestick trading. However, there is no best time frame for a candlestick chart. The perfect time frame depends on the trading approach. If you are a scalper, you won’t succeed in weekly periods. If you use a position trading strategy, minute time frames will be ineffective.
Still, statistics show 5- and 15-minute time frames are the most popular periods. This is because most traders prefer short-term trading.
This article considers the best time frames for candlestick charts and patterns.
Earn profit in 1 minute
What is the time frame?
A price chart reflects an asset’s price movements for a certain period. Periods vary significantly — from one minute to one year. It’s necessary, as different trading strategies can be applied only to particular charts.
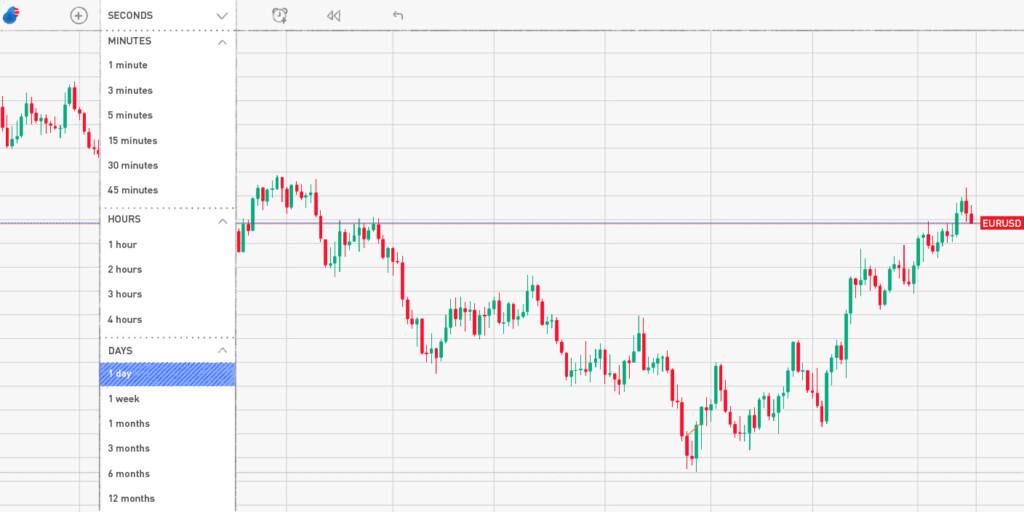
Time frames can be divided into high and low as well as short-, medium-, and long-term.
- Usually, low time frames are all charts from 1 to 30 minutes.
- Higher time frames are those that start with an hourly chart.
Such classification is narrow, as there is a significant difference between hourly and monthly charts. Time frames can also be divided into short, medium, and long.
- Short-term time frames include all minute charts and an hourly period.
- Medium-term time frames consist of 4-hour and daily charts.
- Long-term time frames are weekly, monthly, and yearly.
Effective strategies in your mailbox
Subscribe and discover a fund of trading knowledge
Great! Please check your email
We’ve sent you an email to confirm your subscription
Something went wrong
Try reloading the page. If that doesn’t help, please try again later
A time frame and a trading strategy
As mentioned above, a certain strategy is applied to a particular time frame. For example, when opening a trade for a month, short-term charts won’t allow you to determine entry and exit points.
The best candlestick time frame for day trading

Day or intraday trading is a strategy that assumes that traders close positions before the end of the day. Day traders usually use 15- and 30-minute time frames and an hourly chart. A particular period should be chosen based on a trade’s length and the time you enter the market.
Scalping
Scalping is a trading method that implies opening trades in time frames from 1 to 15 minutes. Longer-term periods won’t work for scalping, as traders aim to open as many trades as possible within one trading day.
Position trading
Position trading is a strategy that enables traders to hold a trade for weeks. As a position will be kept for a long period, it’s useless to analyze small charts—they always bring lots of price noise. The best candlestick time frames are daily, weekly, and monthly periods.
Swing trading
Swing traders prefer longer-term charts as significant price swings occur in solid trends that only appear in high time frames. They usually place trades in daily time frames but consider the overall market conditions in weekly charts and determine entry and exit points in a 4-hour time frame.
Indicators perform according to the time frame. Therefore, their parameters are changed when opening trades with different periods. Candlestick and chart patterns don’t have particular settings. Does it mean they are effective in any time frame?
Trader’s level test
Answer 7 short questions and define your level as a trader. Take the test now to evaluate your real knowledge!
Start test

What time frame is the best for candlestick patterns?
When thinking about what time frame for candlestick patterns you should use, you should consider the trade’s length. Candlestick patterns include up to five candles. It was found that 1-candle patterns work better in low time frames, while patterns with at least three candles can be used in high periods. This is because long-term charts require deeper analysis and more price confirmations.
Takeaway
There is no best candlestick time frame. Every period serves a particular aim and is used for a specific strategy. Moreover, there is a common rule to analyze three time frames for a single trade. For instance, if you trade on a daily chart, you should also analyze price movements in 4-hour and weekly time frames. A smaller period is for entry and exit points, while a higher time frame will help you analyze the overall trend.
Sources:
https://www.investopedia.com/articles/trading/07/time frames.asp, Investopedia’
https://www.thebalancemoney.com/choosing-the-best-chart-time-frame-1031096, the balance
Trading with up to 90% profit
<span>Like</span>