
The Ichimoku indicator is one of the most popular in a wide range of technical analysis tools. It provides numerous signals, including support and resistance, trend direction, and momentum. Some newbies avoid Ichimoku because it consists of many elements. However, if you learn them, you can find reliable signals to use.
Start from $10, earn to $1000
Ichimoku indicator: basics
If you doubt whether you should trade, you can look at the creator of the Ichimoku indicator. This technical analysis tool was developed not by an investor, as most indicators, but by a journalist. Goichi Hosoda, a Japanese journalist, published information about Ichimoku in the late 1960s.
The Ichimoku indicator isn’t only about the Cloud. It consists of five lines — aside from the Cloud, which is built by two lines, it includes three lines that can’t be ignored.
- Tenkan-sen or turning line (blue). It’s a 9-period average.
- Kijun-sen or baseline (red). It’s a 26-period average.
- Senkou Span A. It’s an average of the 9-period and 26-period averages and one of the lines that comprise the Ichimoku Cloud. The line is shifted some periods to the right.
- Senkou Span B. It’s a 52-period average shifted some periods to the right, and the second line comprises the Cloud.
- Chikou Span or lagging line (green). It’s a line that is moved some periods back.
Note: these are standard periods. They can be changed according to your trading strategy.
Senkou Span A and Senkou Span B are shifted to the right. Therefore, the Cloud provides signals on the future price direction. Tenkan-sen and Kijun-sen are just averages; therefore, they reflect the current price conditions. Chikou Span is shifted back, so it stands for a past price.
Effective strategies in your mailbox
Subscribe and discover a fund of trading knowledge
Great! Please check your email
We’ve sent you an email to confirm your subscription
Something went wrong
Try reloading the page. If that doesn’t help, please try again later
Ichimoku indicator signals
As the indicator consists of four elements, it provides a wide range of signals.
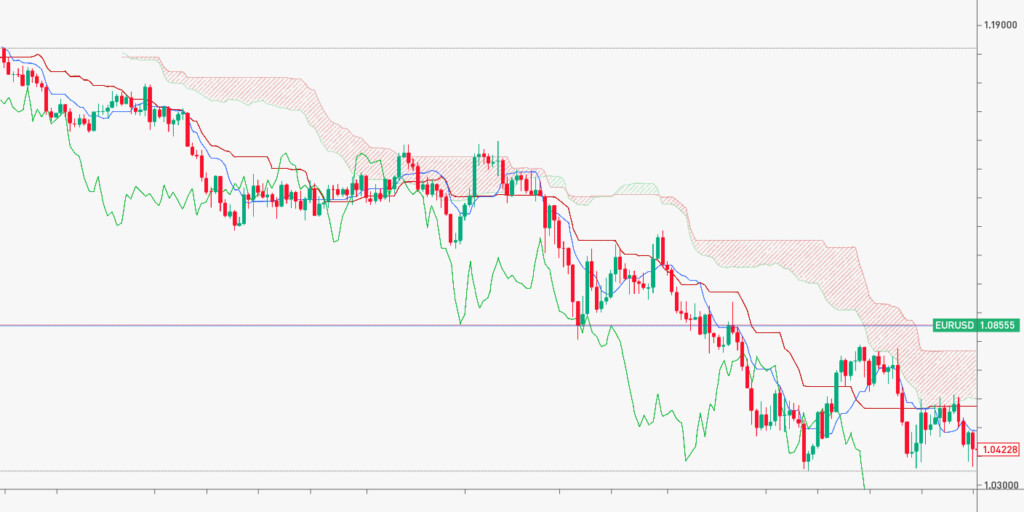
Cloud
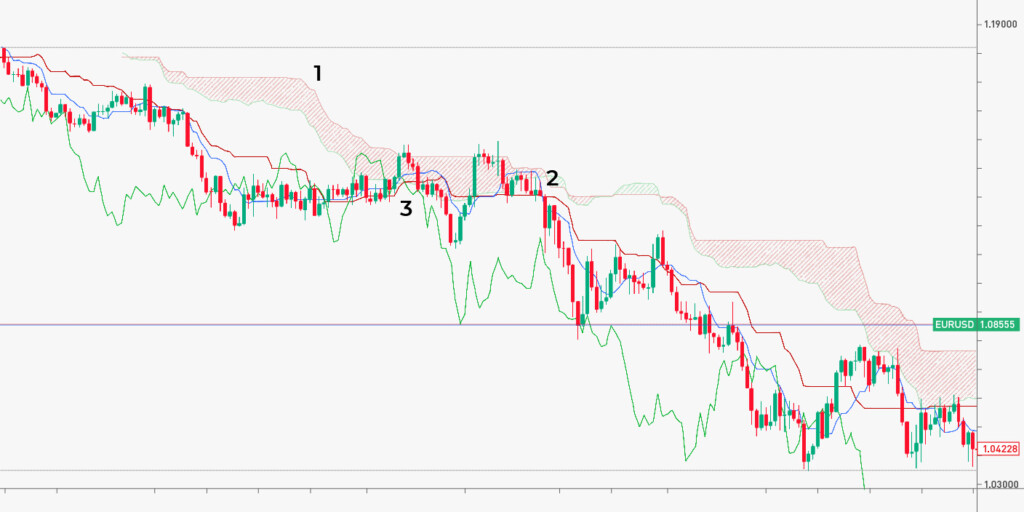
When looking at the Cloud, you can identify the current trend and get signals on the future price direction. Although the colors of the Cloud reflect the trend — the green Cloud stands for a bullish trend, while the red Cloud reflects a bearish trend (1), it’s worth knowing how Senkou Span A and Senkou Span B interact. The trend is bullish when Senkou Span A rises above Senkou Span B. Conversely, when Senkou Span A falls below Senkou Span B, the trend is bullish.

Aside from the color, you should consider the Cloud’s width. If the Cloud is wide, the strength of bulls or bears is strong. If the Cloud is thick, the trend is expected to change.
When the price moves within the Cloud, its boundaries can serve as support and resistance levels.
Tenkan-sen and Kijun-sen
Tenkan-sen and Kijun-sen, turning line and baseline, represent the current price movement and medium-term momentum. The baseline is more critical for price direction signals as it has a bigger period. It’s a common rule that the price interacts with shorter-period averages more often, which may provide additional market noise and lead to wrong signals. Therefore, traders pay attention to where the price is related to the baseline. If it crosses the baseline, the trend may change shortly.
Also, to buy and sell, traders use line crosses. When the turning line rises above the baseline, it’s a buy signal. Conversely, when the turning line falls below the baseline, it’s a sell signal (2).
Chikou Span
Chikou Span or the lagging line can’t signal a future price direction, as it’s shifted back. Still, traders use it to confirm the overall trend.
When the lagging line breaks above the price, traders may consider it a buy signal. If the lagging line falls below the price, it may be a sell signal (3).
How does the Ichimoku Cloud technical indicator work?
The Ichimoku Cloud works by using a collection of technical indicators to show resistance and support levels. At the same time, it may show trend direction and momentum. The indicator does this by taking several averages and putting them together on a chart.
Trading with up to 90% profit
The Ichimoku Cloud comprises five calculations (or lines). Two of those calculations compute a “cloud” that shows the difference between the two lines. The cloud is a very important part of this indicator, as it forecasts where the prices may find resistance and support in the future.
When the price goes underneath the cloud, the trend is going downward. On the other hand, if the price is going above the cloud, then the trend is moving upward.
Cryptocurrencies: what to expect in 2023
2023 is expected to be the year of recovery for the crypto market. Read on to see what to expect in 2023 for cryptocurrencies.
Read more

The formulas for the Ichimoku Cloud
Consider the following circumstances where “PH” is period high, “PL” is period low, and CL is the conversion line. The Ichimoku Cloud will use the following five formulas:
Lagging Span = 26 periods close plotted in the past
By calculating them in the right order, you should be able to get the Ichimoku Cloud indicator result.
How to calculate the Ichimoku Cloud
As the names suggest, the lows and highs are the lowest and highest prices observed over a set period. For instance, if you are using conversion lines, they may be the lowest and highest prices observed over the past 9 days.
There are charts that can calculate the Ichimoku Cloud automatically for you. However, if you want to go old school and calculate by hand, to ensure no technical errors, you may go through the following steps:
1. Calculate the Conversion Line, after which you follow with the Base Line
2. Using the previous calculation, calculate the Leading Span A. Once you get the result of the calculation, you will plot the data point in the future for 26 periods.
3. Next, calculate the Leading Span B. This data should be plotted 26 further days into the future.
4. When calculating the Lagging Span, you should also plot the closing price for 26 days. However, this time will be in the past.
5. You will need to color the differences between Leading Span B and Leading Span A. This will create the cloud you are working with. Different colors are to be used, depending on the result.
6. If you notice that Leading Span A sits above Leading Span B, then the cloud should be colored green. On the other hand, if Leading Span A is located below Leading Span B, the cloud should be colored red.
7. Repeat the calculations to collect more data points.
With steps 1 through 6, you have created the data point. To get a bigger picture, you need to create a line. Each period will eventually come to an end, so you must go through the steps once more to create other data points. Connect them, and you will create a cloud appearance through the lines.
The difference between the Ichimoku Cloud and Moving Averages
The Ichimoku Cloud indeed makes use of averages, but the process is slightly different from your usual moving average. Typical moving averages will add the closing prices and then divide the result by the total number of closing prices. For instance, if you have a moving average set on a 10-period, you add the prices of the last 10 periods and then divide that number by 10.

The Ichimoku Cloud indicators are different. They rely on the highs and lows of a specific timeframe, after which you divide them by two. Therefore, even if you use the same periods and numbers, the results will be different. This doesn’t make one indicator better than the other, as the information is merely given differently.
Final thoughts
Ichimoku Cloud is a popular technical analysis tool. It provides various signals, can be used regardless of the asset you trade, and can be applied to any timeframe. Still, it doesn’t guarantee it provides only reliable signals. Therefore, you should always combine it with chart patterns and other indicators.
Sources:
Ichimoku Cloud, CFI
What Is the Ichimoku Cloud Technical Analysis Indicator?, Investopedia
Earn profit in 1 minute
+1 <span>Like</span>