

Indices (index singular) are ways traders can evaluate the performance of several assets. Better said, indices are a crucial way to measure how healthy stocks from publicly traded companies are doing.
The Dow Jones is a top performer in the league of industry-leading indices globally. This index monitors the performance of top-tier companies in the United States. Whenever there’s an increase in the performance of the top companies on the Dow Jones indices, the Dow Jones Industrial Average hikes higher. In the same way, if the performance of the leading companies reduces, the Dow Jones Industrial Average experiences a decline.
If you’re a trader who wants to know more about index trading, this guide is for you. Shortly you will learn how to trade indices, factors that affect stock prices, and the benefits of index trading. Let’s start with the definition of index trading.
Start from $10, earn to $1000
What is index trading?
In simple terms, index trading is selling and buying the stock market index. Traders and investors will often predict the rise or fall of index prices which will suggest whether they should sell or buy. Because indices represent how stocks perform, you do not have to purchase an actual stock. Instead, you are buying average stock performance.
If the price of company shares within an index increases, the index value will also increase. Similarly, if the price falls, the index value will go down. There are two major types of index trading:
- Index cash CFDs
- Index futures CFDs
The difference between the index cash market and the index futures market is that there is no expiry date for the cash market, while the index futures market could expire. This is often called a rollover in the index futures market.
Effective strategies in your mailbox
Subscribe and discover a fund of trading knowledge
Great! Please check your email
We’ve sent you an email to confirm your subscription
Something went wrong
Try reloading the page. If that doesn’t help, please try again later
Frequently traded indices
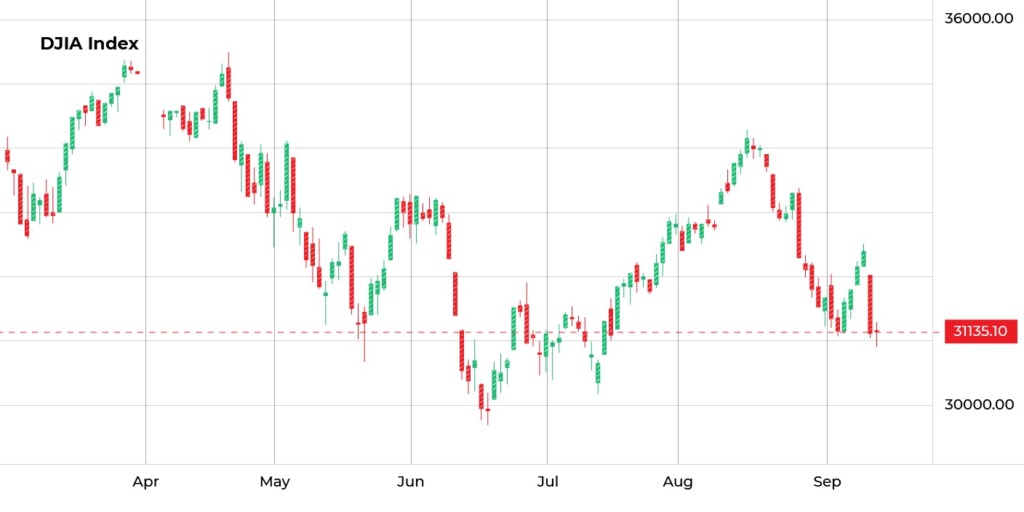
1. DJIA (Dow Jones Industrial Average)
This index measures the value of the 30 largest blue-chip stocks in the United States.
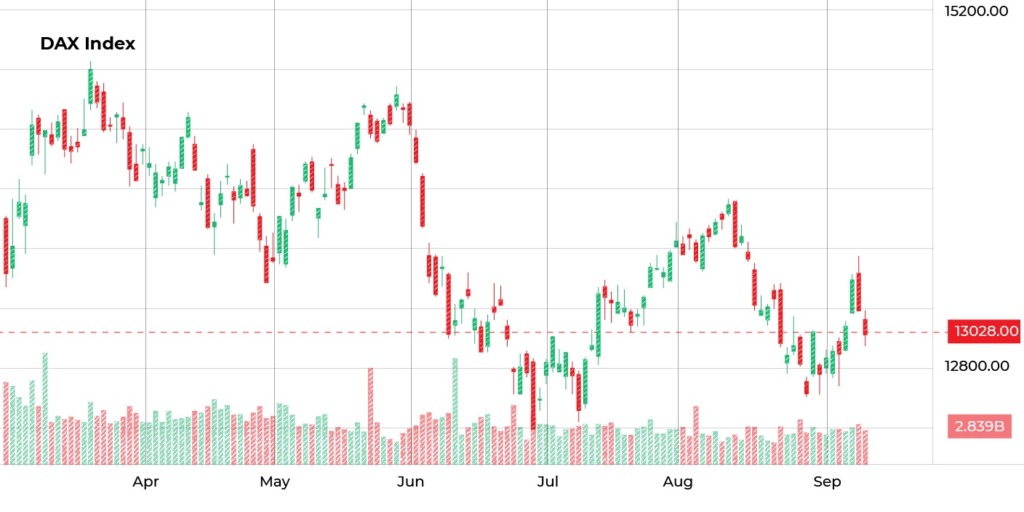
2. DAX (Germany 40)
This index keeps track of the performance of the 40 biggest companies on the Frankfurt Exchange.
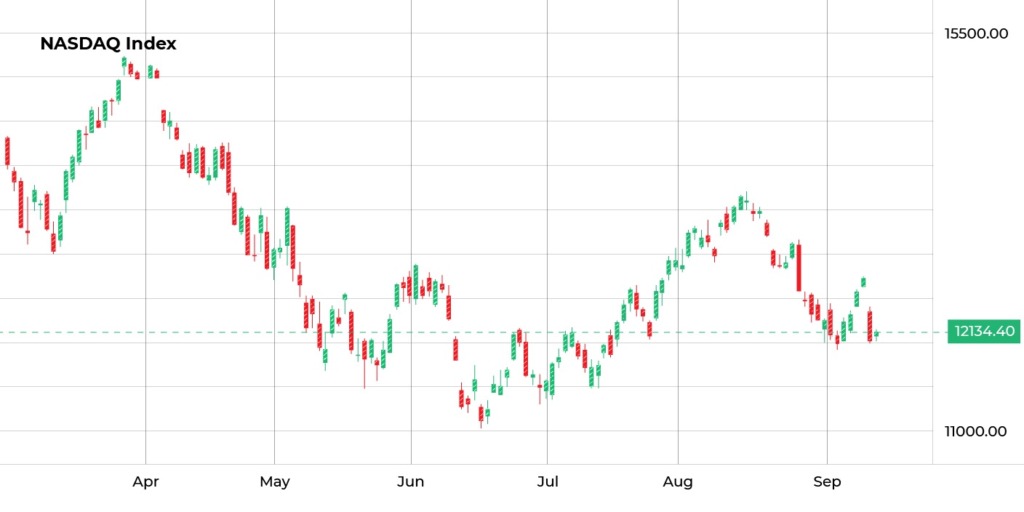
3. NASDAQ 100 (US Tech 100)
NASDAQ reports the market value of the 100 largest non-financial companies in the United States.
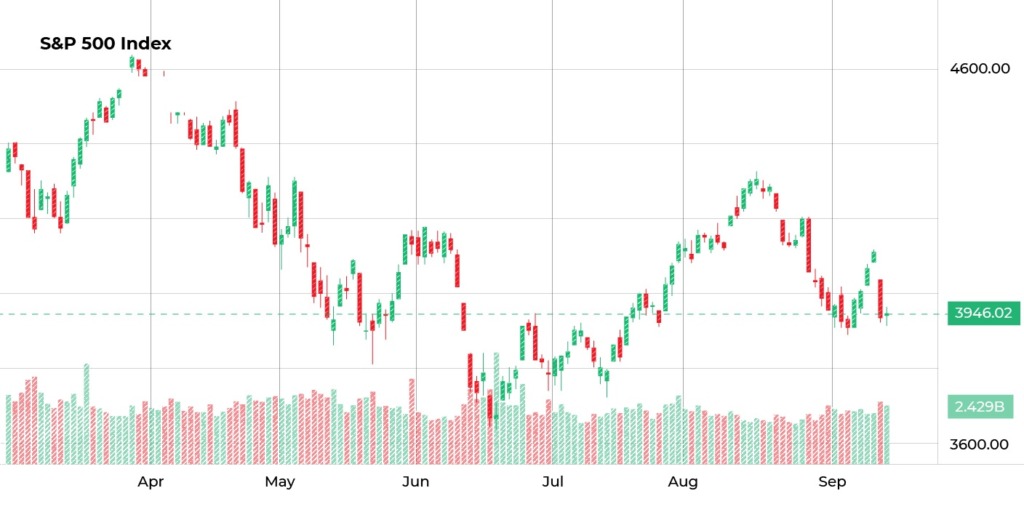
4. S&P 500 (US 500)
This index keeps track of the value of 500 large cap companies in the United States.
There are factors responsible for index market price fluctuations
Traders must know that the index market price varies based on different factors. Generally, the prices of indices will decrease during seasons of uncertainties that can weaken the country’s economy.
Trading with up to 90% profit
Some of the significant factors that affect the index market are:
1. Global news
Notable global events such as a pandemic or natural disaster will permanently alter the index market. But, again, this is a result of the affected nation’s economy.
2. Commodities
The index market may contain commodities stocks which will affect the index’s performance when there is market fluctuation.
3. Company trends
Essential company news is yet another factor that affects the index market. This can happen whenever there’s an announcement to give a company’s financial report about new leadership or a merger.
7 golden rules of trading
Everyone has their own trading style, but some principles are critical for success. Make sure you’re following these basic rules of trading.
Read more

Know the steps to index trading
You can trade the index market by simply following the steps below:
Choose which index you’ll like to trade.
Another vital point to consider when planning to trade indices is the index you’ll be trading. Different indices suit different trading styles; thus, settling for what is ideal for your trading style is expedient. Again, this concerns your risk management, capital, and trading period.
For instance, the US 500 is well known for its low volatility and consistent return over a period. This makes it a suitable index for traders with low-risk appetites and investors with a long-term trading view.
Choose to go short or long.

It is always up to you to decide whether to trade short or long. Trading long means you are speculating on an index value to increase while selling short means you’re speculating on the index value to decrease.
Choose between index futures and cash indices.
Getting insight into an index’s price can be either by trading index futures or cash indices. Long-term traders prefer trading index futures because it offers a broader spread that supports their extended market outlook. On the other hand, cash indices are preferred by day traders because of their tight spread.
Set limits and stop orders
Limits and stops are instrumental in risk management when trading indices. Stop orders will ensure that your open position is closed when the market goes against your speculations. On the other hand, the limit order closes your position when there’s a good move.
Day traders rarely monitor prior days
The majority of day traders will spend most of their time looking at current data – the kind that they got throughout the day. Sure, they may look at some data from the previous days to get a pattern, but what matters most is what’s happening throughout the current day.
As a trader, you need to focus on the now. Loads of history can give you a slight hint of your direction, but it won’t help you much when making a specific trade. What was popular yesterday may no longer be as popular today, which is why you need to look at the daily charts.
The only times when you should monitor previous days is when you are putting together your trading strategy. For instance, some opportunities will require you to know price gaps and signals. In these cases, knowing past price behavior may prove useful for you.
Take a lunch break and continue your time frame extension afterward
You may be tempted to spend most of your time trading and doing non-stop work. You may also attempt to take your computer with you on your break, but a better idea would be to just leave it. Take your lunch break, because nothing will likely happen during that time.
The majority of traders will trade around the open, but they’ll often stop somewhere around 11:30 A.M. ET. This is shortly before the standard New York lunch hour. During this time, things are very quiet and with few trading opportunities, so you can catch a break without missing much.
Trading resumes after lunchtime passes, at which point you can continue extending your time frame. This is usually around 1 PM. Some prefer to wait even more, resuming their activity somewhere around the close. Since activity is higher then, the potential for opportunity is greater.
Best time frames to monitor
Different time frames won’t necessarily affect the information that you see, but how they are delivered may still differ. For example, while long-term charts may not show too much detail, short-term charts do. You can still see detail in long-term trades, but the times need to be approached differently.
When you are trading with day stocks using one-minute charts, you may want to do most of your trades during the open. Most transactions occur during that time, and you can make a few big trades in mere minutes. On the other hand, 10-12 bar tick charts should be monitored a couple of minutes after they open. The best time to monitor is when the number of bar ticks suits your preferred type of stock.
Start trading
Once you have satisfied all the above requirements, you are ready to start trading indices. Go to your preferred market and open a trading position.
Conclusion
As index trading continues to gain mileage, traders need to understand the essential factors that make for price movement in the index market. Investors should also pay attention to those indices that favor their trading strategy. This guide is sure to get you started with trading indices.
Earn profit in 1 minute
<span>Like</span>