
Oscillators are momentum indicators that identify periods when an asset is overbought and oversold. It’s easy to recognize oscillators, as they are placed below a price chart and move within a particular range. Oscillators are believed to be highly reliable tools.
Earn profit in 1 minute
Interestingly, there is a disagreement between those who support technical analysis and fundamental analysis. For instance, in 2007, Irwin and Park issued a review claiming that 56 of 95 modern studies confirm that technical analysis provides positive results. Still, many of the positive results were questionable due to issues with data tracking. However, only by practicing can you make your own conclusions.
What is an oscillating indicator?
An oscillating indicator, as the name suggests, is an indicator that goes upward and downward within a band. When the readings of the indicator are high, it means that the securities you are working with are being oversold. On the other hand, if the readings are low, they suggest that said security is being oversold.
Oscillating indicators are also referred to as mean-reverting indicators, and there are various ways for you to interpret them. The most commonly analyzed conditions are the overbought and oversold ones, provided over a 7-day RSI. As a trader, you need to determine which specific indicator works best with your oscillating indicator.
Effective strategies in your mailbox
Subscribe and discover a fund of trading knowledge
Great! Please check your email
We’ve sent you an email to confirm your subscription
Something went wrong
Try reloading the page. If that doesn’t help, please try again later
What is the best time frame for oscillating indicators?
With trading, it is rather impossible for someone to determine the best timeframe for oscillating indicators. Trading never really stops, which is why there aren’t any absolute answers. However, to limit your losses as much as possible, you may want to go for shorter time frames (2-10 days). Anything more than that can lead to substantial mass downturns and be less efficient.
If you want to be successful as a trader, you need to be efficient. You must obtain the highest return on your capital in the least amount of time. This is usually done through inefficiencies in the market. While they are not that rare, they are often short-lived. This gives you a short timeframe to work with.
Oscillating indicators are primarily mean-reverting indicators
Over time, the S&P 500 has shown that it has mean-reverting properties. For the most part, oscillating indicators are mean reverting, which makes them dependent on this factor. Indeed, this was not always the case, as things used to be different before the 90s. That being said, this does not guarantee it will remain the same in the future.
Start from $10, earn to $1000
Different oscillating indicators will measure different things. Here are the most popular options that traders use:
1. Williams %R
The Williams %R indicator oscillates between 0 and 100, bearing a resemblance to stochastic indicators. This oscillator indicator will reflect on the market’s current close relative, comparing it to the highest high over a certain timeframe. If you get high readings, it means that the asset is being overbought. Similarly, if you get a low reading, it means that it will be oversold.
Therefore, this oscillator will chart a recent price action magnitude. When you use this indicator, you’ll want to see values going over 70%. This trend will tell you that you are in a good position to sell. On the other hand, if your purpose is to buy, you may want to look for values under 30% to succeed.
2. Relative Strength Index (RSI)
The Relative Strength Index is slightly different from the Williams %R, as it measures the magnitude of losses and gains alike. It looks at the relative strength of your asset and compares it to the price movement over a specific timeframe. Traders use it to identify momentum and market conditions, but also to check for price drop signals. Used correctly, the indicator can help you minimize losses.
Like Williams %R, the minimum value can be 0 and the maximum is 100, with over 70 being overbought and under 30 being oversold. If you get an overbought signal, it means that the short-term gains are getting close to the maturity point. This suggests that the assets may be due for a price correction.
On the other hand, if you reach an oversold signal, it will suggest that the short-term declines are coming close to maturity points. The assets here may be in for rallying.
3. The Internal Bar Strength Indicator (IBS)
Internal Bar Strength indicators will measure the close-low/high-low. Values go between 0 and 1, depending on the day’s readings. If you are closer to 0, then it means your value for the day is equivalent to the current day’s low. On the other hand, if your value is closer to 1, then it means the value will be at the current day’s high.
4. Bollinger bands
Bollinger bands are indicators that tell you which price an asset will trade in. The band’s width will decrease or increase to reflect volatility. The closer the Bollinger bands are to one another, the lower the volatility. On the other hand, if you have wider bands, the volatility is also wider. Traders use it to predict long-term movements of the price.
5. WilliamsvixFix
The WilliamsvixFix is an indicator developed by tax rebellion and trader Larry Williams. It’s meant to be used as a real VOX proxy on stocks, ETFs, and other financial assets. When used, it will look back at the lowest and highest quotes over the last n days.
The result will be an indicator that resembles the real VIX (visually, at least). It shows volatility so that you know how to plan your strategy for the long term.
5 of the best scalping indicators to use right away
You can experiment with various indicators, but there are some you can use right away to build your best scalping strategy.
Read more

Relative strength index
The relative strength index, or RSI, is an oscillator that determines whether an asset is overbought or oversold, provides exact entry and exit points, and signals trend reversals.
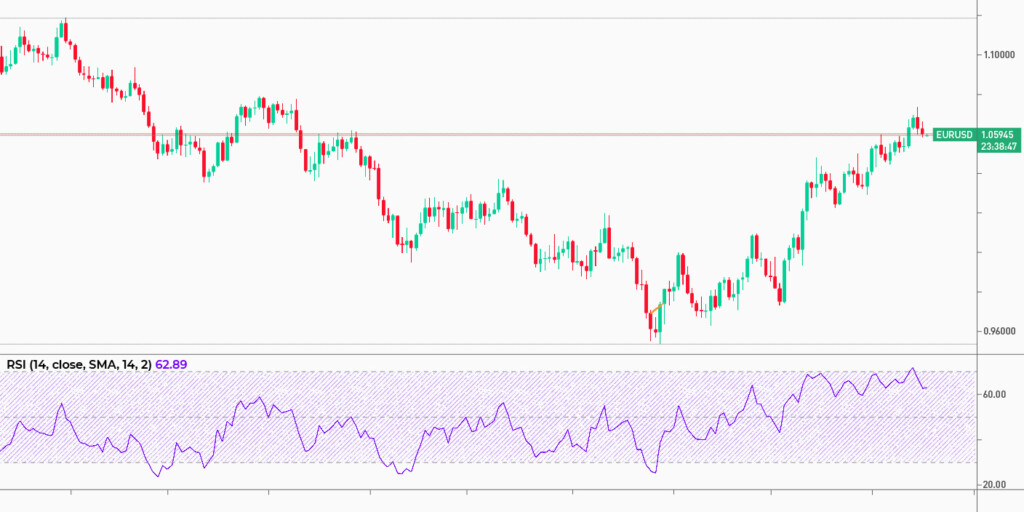
The indicator has only one setting — period. The standard period is 14. It can be reduced when applying the RSI to low timeframes and increased when trading on higher timeframes.
Overbought/oversold conditions
The indicator consists of one line that moves within a 0-100 range. Its key levels are 30 and 70. When the RSI rises above 70, an asset is overbought, so the market may turn down soon. When the RSI is below 30, an asset is oversold, so its price may rise soon.
Traders should remember that a trend reversal is confirmed only when the oscillator leaves the overbought/oversold zone. Also, they should be cautious and confirm RSI signals because the indicator may return to zones several times before the market reverses.
Divergence
A divergence is a strong signal occurring when an oscillator doesn’t confirm a price movement. There are bullish and bearish signals. The picture below shows the general rules.
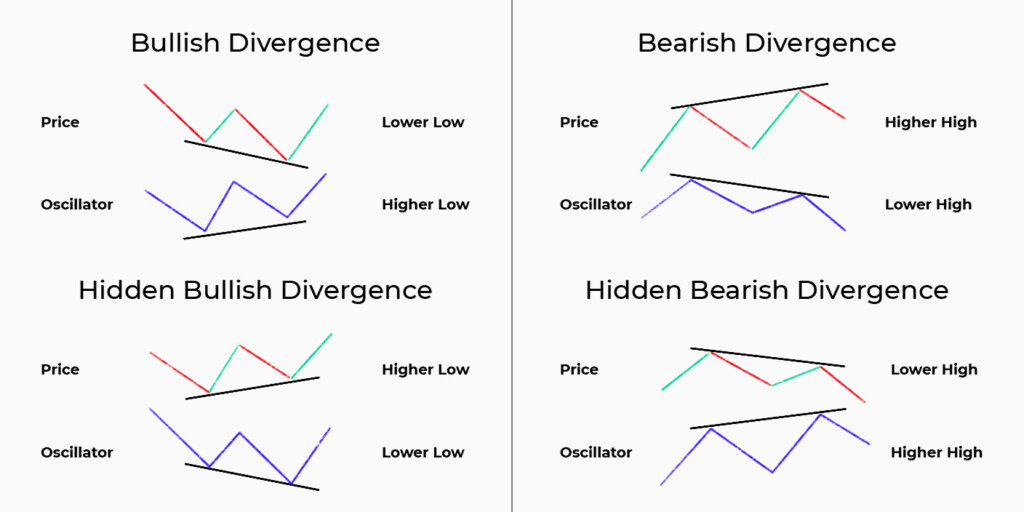
Hidden divergences provide weaker signals but can be used if confirmed by other indicators or patterns.
Stochastic Oscillator

A stochastic oscillator is an indicator that resembles the RSI as it moves within a 0-100 range and provides similar signals. However, the RSI is more effective in a trending market, while Stochastic is more applicable in consolidating markets.
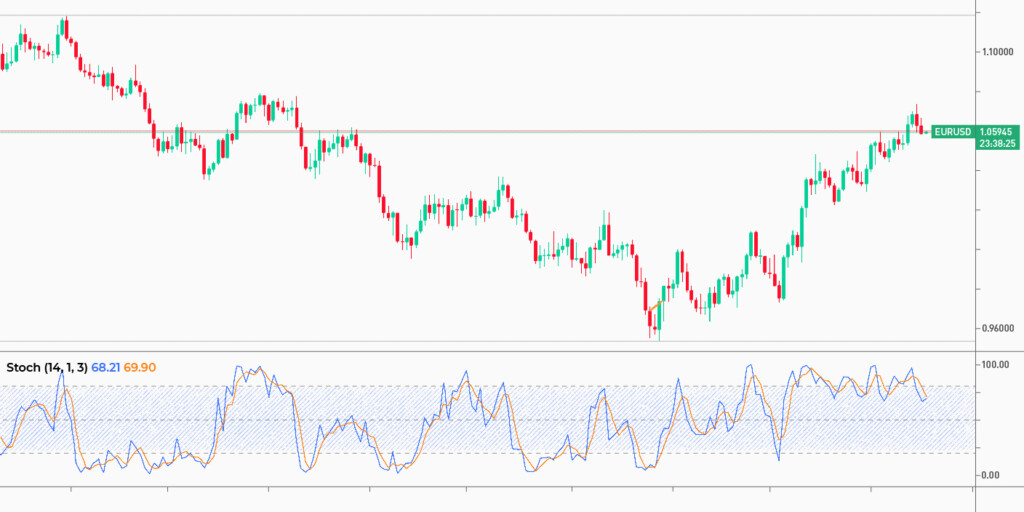
The stochastic oscillator consists of two lines: the %K line and its moving average %D line. Stochastic’s key parameters are 14 and 3, where 14 stands for a period of the %K line (fast stochastic) and 3 is a period of the %D line.
Divergence
Divergence signals are the same as for the RSI indicator.
Overbought/oversold conditions
Like the RSI, the stochastic oscillator reflects conditions in which an asset’s price is too high or too low. Stochastic’s key levels are 20 and 80. When the oscillator is below 20, an asset is oversold, and the price may rise soon. When the oscillator is above 80, the price may fall quickly as an asset is overbought.
Crossovers
You can also use line crossovers to catch buy and sell signals. When the %K line falls below the %D line above 80, it’s a sell signal. When the %K line rises above the %D line below 20, it’s a buy signal.
Takeaway
There are numerous oscillators, and there is no perfect one that would suit any strategy. You should select the one that will fit your approach. If you are a newbie trader and haven’t chosen an indicator, you could start with the relative strength index and Stochastic.
Sources:
https://www.investopedia.com/terms/o/oscillator.asp, Investopedia
https://www.babypips.com/learn/forex/leading-indicators-oscillators, babypips.com
Trading with up to 90% profit
<span>Like</span>