
Japanese candlestick patterns are one of the tools traders have used for decades to predict a price direction. Although it’s generally believed that the candlestick system was developed in the 18th century by a rice trader Munehisa Homma, Steve Nison, who introduced candlesticks to the Western World, doubted this fact. He guessed candlestick charts were developed in the late 1800s.
Still, the exact origin of candlesticks doesn’t affect their effectiveness. Does it mean candle patterns are perfect and provide only accurate signals, or do you need to implement some strategies to make them work for you? Here’s what you need to know for candlestick patterns to work for you.
Earn profit in 1 minute
1. You need to know how to read patterns
There are two main classifications of candlestick patterns — reversal and continuation. Continuation patterns confirm the trend will continue. Reversal patterns appear when the trend is expected to reverse. Also, there are bullish candlestick patterns and bearish candlestick patterns. Your challenge is to remember whether the pattern predicts a rise or a decline in a price.
Look at the picture below.
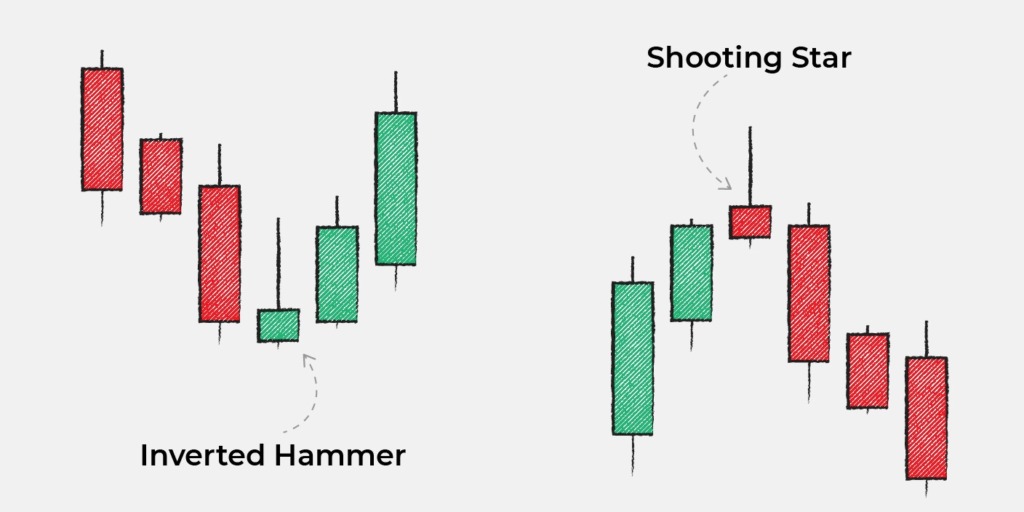

These are two similar candlesticks with such inverse signals. The inverted hammer occurs after a downward movement and predicts a price rise. The shooting star forms at the end of a bullish trend and signals a price decline. If you confuse their signals, you risk losing your funds. Therefore, until you learn all the necessary patterns and practice your skills on historical price movements, you shouldn’t implement candlestick signals into your trading strategy.
Effective strategies in your mailbox
Subscribe and discover a fund of trading knowledge
Great! Please check your email
We’ve sent you an email to confirm your subscription
Something went wrong
Try reloading the page. If that doesn’t help, please try again later
2. You need to know how to confirm signals
When trading candlestick patterns, you must confirm their signals with at least one indicator, and you will see why. When you read tutorials, you see perfect conditions. Look at the picture below.
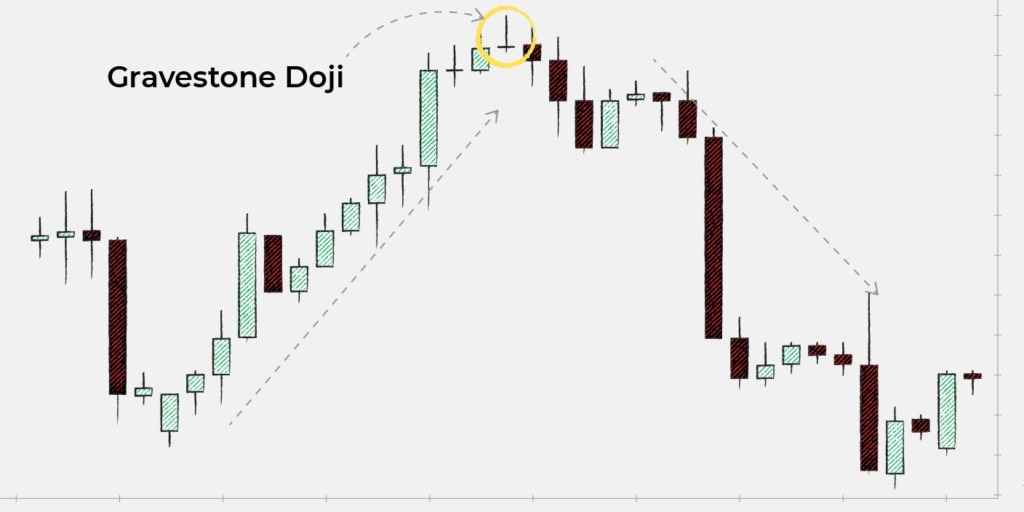
It’s an example of how the gravestone-doji-candlestick pattern is supposed to work. Look at the real chart.
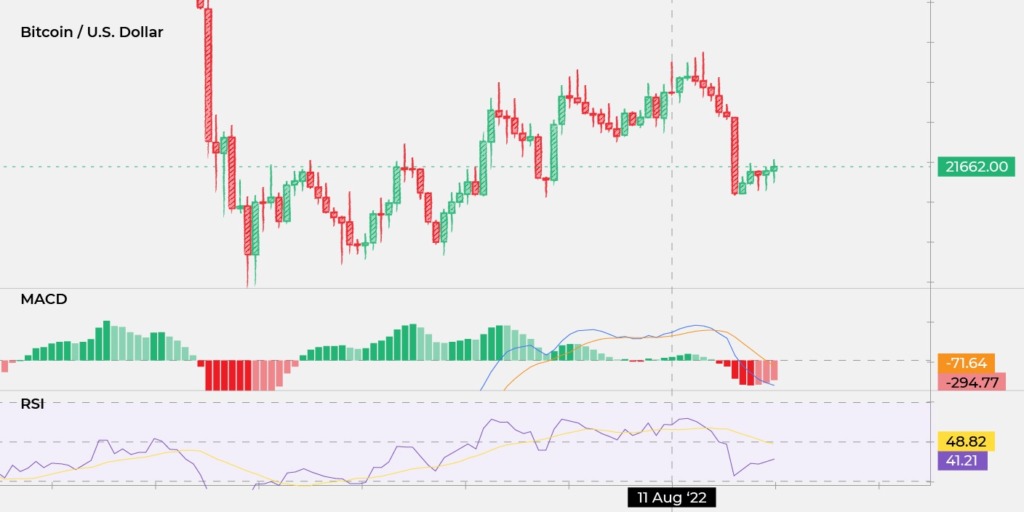
On August 11, 2022, the BTC/USD price formed the gravestone doji candlestick. Expecting the price to fall immediately after the signal, you could open a short trade. However, the price continued rising for the next two days. If you set a stop-loss order slightly above the entry point, you would be kicked off the market.
However, if you looked at MACD or RSI indicators, you would notice that MACD and RSI were trading above their signal lines at that time. Thus, there was no confirmation of the price decline.
Lesson
To make patterns work for you, you must always look for confirmation even though the pattern looks perfect. The key pitfall is to choose an indicator that will confirm on time.
In the example above, you see the daily chart. Therefore, you could use lagging MACD and RSI indicators. However, if you traded on shorter timeframes, you would simply miss a good entry point.
Your aim is to practice candlestick patterns on various timeframes and look for indicators that can provide effective confirmations.
Moreover, you should pay attention to an asset’s level of volatility. If you trade an asset with high volatility, there can be numerous candlestick patterns with inaccurate signals.
3. You need to know fundamental factors
The easiest way is to implement patterns when trading on Forex or the stock market. Of course, there are no specific equity or Forex candlestick patterns. However, there are well-known fundamentals that help traders predict a price direction.
Trading with up to 90% profit
For instance, the US dollar highly depends on meetings of the Federal Reserve and Nonfarm Payrolls releases. And all stocks depend on companies’ internal events.
Therefore, even if there is a candlestick pattern, but an event’s outcome forecasts opposite price direction, trust the event, not a candlestick. The event may turn the market no matter what timeframe you trade on.

It’s a bigger challenge to find fundamental factors affecting a particular cryptocurrency. However, you can still find some by following its social media.
7 golden rules of trading
Everyone has their own trading style, but some principles are critical for success. Make sure you’re following these basic rules of trading.
Read more

Examples of candlestick patterns
Candlestick patterns come in several forms. The patterns will surround the price bar, predicting whether it will go higher or lower. Here are the most common examples:
1. Spinning Top and Doji
Doji and spinning tops are candlestick formations where the close and open points are nearly the same. The only difference between the two is the size of the body, as the spinning top is usually much smaller. Both patterns suggest that the market is indecisive, as the sellers and buyers have fought themselves to a standstill. That being said, these patterns are important, as they can alert the trader once the indecision goes away.
2. Bullish and Bearing Engulfing Lines
Engulfing lines are essential in the world of trading, as they tell exactly whether there is a directional change or not. Bearish engulfing lines are reversal patterns that happen after an uptrend. They suggest a stalling uptrend that has started to go lower. Bullish lines are the opposite, as they appear during a downtrend. They suggest that the current trend is supposed to end, going higher.
3. Hanging Man
The hanging man is a reversal candlestick pattern that takes place after a price increase. The amount can be either big or small, but it should at least have a few price bars going up. This pattern is usually no more than a warning, suggesting that the price needs to go lower (or at least onto the next candle). Otherwise, it will no longer be valid as a reversal pattern.
4. Hammer
A hammer suggests that a move that was going down is finally ending (i.e., hammering down). Hammers often have a long lower tail, which suggests the seller tried again lower, only to be rebuffed. At that point, the price erased nearly all losses of the day (if not entirely). The hammer also indicates a price reversal on the upside, a process that is referred to as “confirmation.”
5. Abandoned Baby Top/Bottom
The abandoned baby is frequently referred to as the island reversal. As the name may suggest, it signifies that a major reversal in the previous directional movement is likely to occur. Abandoned baby tops will usually occur after an uptrend, whereas the abandoned baby bottom will take place after a downtrend. The candlestick pattern forms when two separate gaps segregate a clump of trading days.
Which candlestick pattern is most reliable?
There are many candlestick patterns that traders often swear upon. Each pattern has its use, so we cannot say which one is better than the other. The most popular are the following:
· Bearish, bullish long-legged doji
· Bearish/bullish engulfing lines
· Bearish/bullish abandoned baby (top/bottom)
Neutral reversal signals can also appear, and they can turn out to be quite reliable. They may keep you informed about what your next trading move should be.
Does candlestick pattern analysis really work?
Yeah, candlestick pattern analysis works if you know how to use it. Just follow the rules and wait until you get confirmation. For the most part, this will appear on the candlestick of the next day.
Traders often use candlestick patterns to see where the market direction is going. They are not used to seeing where the prices will be in the next couple of hours. As a result, a daily candlestick will likely be more effective as compared to a shorter-term one.
How do you read a candle pattern?
You read a candlestick by determining whether it’s bearish, bullish, or neutral (i.e., indecision). Watching these candlesticks form can be rather irritating and time-consuming, which is why you ask for confirmation. At that point, you will have every ground for taking a trade.
Make sure that you don’t see patterns when there aren’t any. This can lead to trading losses. When you are uncertain, you should just let the market progress in its way. Eventually, you will have a candlestick signal with a much higher probability.
Final thoughts
Newbies believe they only need to learn some of the most popular patterns, and they will succeed in trading, but this isn’t the case. Candlestick patterns actually work if only you know how to use them.
Start from $10, earn to $1000
<span>Like</span>