
Technical analysis is a vital part of any trading approach, especially day trading. As the market changes rapidly, you need to be equipped with numerous reliable tools to help you evaluate market conditions and forecast upcoming price fluctuations. Technical analysis includes all of them but has some unique features you should consider. Learn how to apply technical analysis to trade within a day.
Start from $10, earn to $1000
What Is the meaning of technical analysis?
Technical analysis is a process commonly referred to as chartism, which looks over the intrinsic values of a stock. To put it simply, technical analysis uses charts to analyze trading volume and create a pattern. This way, traders will know whether a stock has the potential to rise or fall in the future.
Effective strategies in your mailbox
Subscribe and discover a fund of trading knowledge
Great! Please check your email
We’ve sent you an email to confirm your subscription
Something went wrong
Try reloading the page. If that doesn’t help, please try again later
Assumptions of technical analysis
Technical analysis often comes with three assumptions, which can be broken down into the following:
1. Everything is discounted through the Market
According to technical analysis, the prices of the stocks are a reflection of the current state of the market. If the fundamental factors of a specific company have been affected, or if a change has been noticed in the supply and demand, then this will affect the prices of the stocks as well.
2. Prices follow a trend

Rather than moving without a pattern, technical analysis assumes that prices often follow a specific trend. This can be either bearish or bullish, which will continue repeating itself in the future. The price will move in a certain established manner until a new trend takes place.
3. History often repeats itself
Technical analysis also works on the assumption that human behavior tends to repeat itself, making trends equally repetitive. Since there is often a repetitive pattern in stock prices, chartists usually look at stock prices in the past to determine a price for the future.
Technical analysis indicators and patterns
Technical analysis uses numerous patterns and indicators to analyze stocks. Here are the most common ones:
Trading with up to 90% profit
1. Support and resistance levels
Support and resistance levels designate where the supply and demand meet. These prices are tough to break by an index or a stick. Support means that there are more buyers than there are sellers, whereas resistance means there are more sellers than there are buyers.
2. Trading volume
Trading volumes aim to validate a specific trend, suggesting bullishness or bearishness. A low trading volume means that there is a low trading activity with few buyers, suggesting bearishness. However, a high trading volume indicates a high trading activity with many interested buyers. This usually means bullishness.
3. Moving average
Moving averages record stock pattern values over specific time frames. They smoothen over the daily activity by giving an average number repeated at specified times. 20-day and 50-day moving averages are the most common, but traders calculate over multiple time frames.
Cryptocurrencies: what to expect in 2023
2023 is expected to be the year of recovery for the crypto market. Read on to see what to expect in 2023 for cryptocurrencies.
Read more

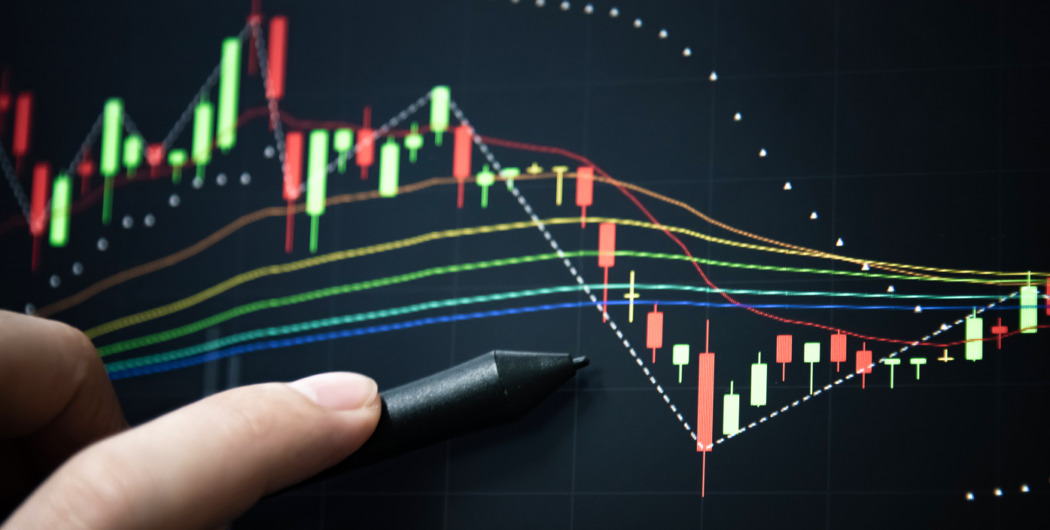
Technical analysis of the financial markets
Technical analysis is an approach in which traders use indicators, tools, and patterns to predict an asset’s value. Indicators reflect market data and price action, tools allow traders to draw market trends, and patterns determine how far and in which direction the asset’s price may go.
Technical analysis is an effective method for any strategy. However, day trading requires more instruments, as it differs with more significant volatility.
For instance, long-term traders don’t care about a trader’s lunch. But intraday traders should remember volatility is higher from 11 a.m. to 2 p.m.
You can use technical analysis for any financial asset, but each one will require specific tools for a more accurate price prediction.
- Stock technical analysis
Stocks are among the most volatile financial markets, especially on intraday timeframes. Therefore, you need technical tools that reflect price volumes and indicators with the smallest lag.
- Crypto technical analysis
Cryptocurrencies are also a subject of high volatility. Therefore, you need to measure price volumes and use technical indicators that predict trend reversals.
- Gold technical analysis
Gold is quite a stable asset that moves in solid trends. Here, you need to apply trendlines and trend indicators to forecast gold’s value. It’s also worth considering chart patterns that form for a while.

Fundamentals of technical analysis
When applying technical analysis, you should keep in mind some assumptions that will assist you when making trading decisions.
- Trends
It’s more likely you have already heard that you should trade in a trend and never go against it. It’s not a requirement, but you should remember that a price always moves in a certain direction and never randomly.
There are three types of trends: up, down, and sideways. They change around. This feature allows traders to predict the price direction correctly. You can trade either within a strong trend or on its reversal.
This assumption is even more vital for day traders. When trading within a day, it’s harder to forecast the price direction because price volatility is higher on short-term timeframes.
Trend trading makes the price projection easier because the price moves within a certain pattern, and it’s more likely it will keep fluctuating according to certain rules (if an unexpected event doesn’t occur).
- Events are priced in
Technical analysis traders believe there is no point in considering technical analysis and fundamental analysis separately. The supply/demand factor determines an asset’s price. This means that market participants have already reacted to fundamental events. However, it’s not an absolute rule.
When the current price reflects everything that could or has affected it, you need to consider upcoming fundamental events to predict its future direction. A day trader should remember that the market experiences large volatility, especially around significant economic events.
- Historical data
When using technical analysis, traders assume that trends repeat as market participants are used to behaving in a certain way in similar circumstances. Therefore, to predict the price direction, it’s enough to check how the asset behaved in the past. When you need to react to market conditions fast, you should be equipped with knowledge of potential price movements.

Fundamental analysis vs. technical analysis: why the latter matters more for intraday trading
Both fundamental and technical analyses are essential for trading. Most traders combine both approaches because it’s hard to avoid one when applying another. Nevertheless, it can be said that technical analysis is more critical for day traders.
- First, it’s impossible to predict the price value using fundamental factors. Such factors don’t occur every minute. On average, critical events happen once a day. This means that you won’t be able to open many trades.
- Second, only technical analysis that reflects market sentiment and the strength of market participants can help you understand whether the event was important for the future rate value.
- Third, fundamental analysis can signal whether the price will appreciate. However, technical analysis has reliable tools that can confirm the signal.
- Fourth, when trading on low timeframes, you should definitely apply take-profit and stop-loss levels. Only technical analysis can determine accurate levels.

Pitfalls of intraday technical analysis

Day trading requires quick reactions to current market circumstances. Although technical patterns repeat and provide the same signals in most cases, you may get the wrong alerts if the market is highly volatile. Therefore, you should be flexible.
When applying technical tools, you always need to look for signal confirmations. It’s not enough to find a trend. You need to use other instruments that will make your predictions correct.
Final thoughts
Although technical analysis has some drawbacks in highly volatile markets, it allows traders to predict the price direction accurately in low timeframes. To increase the opportunity of successful short-term trades, you should combine technical and fundamental analysis.
Earn profit in 1 minute
<span>Like</span>