
Do you remember the heated discussions about Laurel or Yanny? That short audio clip was one of the most divisive subjects, on par with the “blue or gold” dress controversy a few years prior. “The secret is frequency,” said Lars Riecke, an assistant professor of audition and cognitive neuroscience.
In that case, there was a correct answer. The original recording was taken from vocabulary.com and said “Laurel.”
But in other cases, the answer is not as clear. One such case is the difference in chart readings and interpretations by different traders. Let’s go over five main reasons why it happens.
Start from $10, earn to $1000
1. Differences in settings (types of charts, colors, timeframes, key levels)
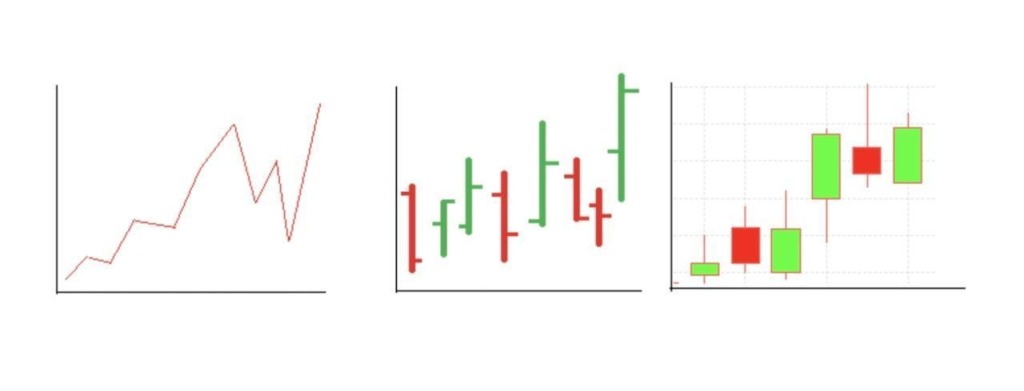
As you change the look of your chart, you will be able to see different data and draw different conclusions from it.
For example, you can change the type of chart (candlestick, line, bar, volume, range, etc. ), (white, gray, and black), timeframes (1M, 5M, 15M, 30M, 1H, 4H, 1D, and 1W). You can set several support and resistance levels and pivot points. Your chart settings will always be different from someone else’s—in a sense, you’ll always be looking at a slightly different chart.
Effective strategies in your mailbox
Subscribe and discover a fund of trading knowledge
Great! Please check your email
We’ve sent you an email to confirm your subscription
Something went wrong
Try reloading the page. If that doesn’t help, please try again later
2. Charts with indicators vs. clean charts

Indicators will also change the look of your chart. Some traders like to add so many technical analysis indicators that it starts to look like a piece of modern abstract art. Other traders prefer a clean view of the price action. Inevitably, this leads to a different perspective on the same market.
Consider only adding one or two indicators of the same type at a time—trend, mean reversion, relative strength, volume, and momentum.
3. Trend followers vs. contrarians, technical vs. fundamental traders
People follow different trading approaches. For example, trader A may look at a chart going up and, as a natural contrarian, wants to trade opposite to the short-term momentum. So, they want to short into the strength. Trader B may see that same chart and think that it’s all going well.
Trading with up to 90% profit
The differences in technical and fundamental analyses will also affect how you view a chart. If you’re a fundamental trader, you may not even assign importance to what you see on the chart.
5 of the best scalping indicators to use right away
You can experiment with various indicators, but there are some you can use right away to build your best scalping strategy.
Read more

4. The effect of trading biases on chart readings
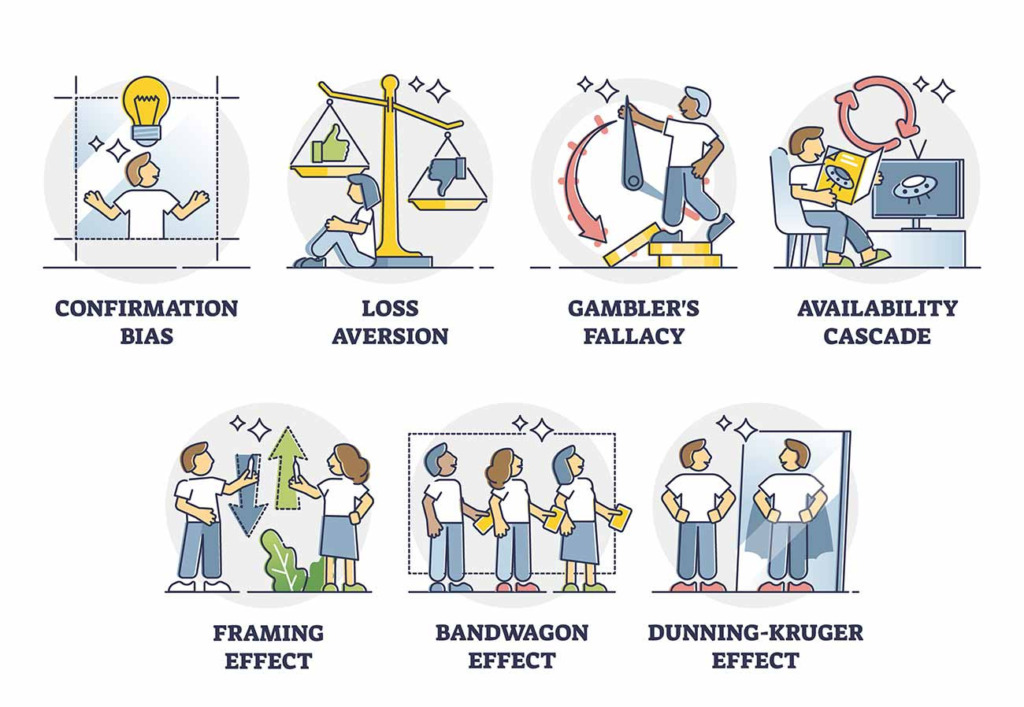
Most people approach trading with inherent bias, whether they realize it or not. For example, you may mistakenly believe that a particular event is less or more likely to occur because of past events. So, you may believe that a stock will gain value after a series of trading sessions with negative movement.
Two traders may hold different biases, which will skew their judgment unless they let them go.
5. External factors (workspace layout, Internet speed, etc.)
No two traders are exactly alike, and there will be many factors affecting their trading day – from the layout of their home offices and Internet speed to the country they live in and the news sources they consume. Traders will also all have different life experiences, professional and educational backgrounds, available trading capital, and levels of risk aversion—the list could go on.
It turns out that true objectivity is hard to come by in trading.
Who is right?
There are millions of reasons why two different people interpret a chart one way and the other. Sometimes, one person is plain wrong. Maybe they are not focused enough, maybe they lack the skill to understand the nuances of price action, or maybe it’s something else.
However, you can’t rule out the possibility that both of the traders can be wrong… or that both of them can be right. It doesn’t mean whose interpretation was “more correct.” What matters is how they applied this knowledge in trading.
Don’t try to be the most precise trader. Aspire to be the one who can adapt it to market conditions even when the chart was interpreted incorrectly.
Earn profit in 1 minute
<span>Like</span>